Multifamily Housing
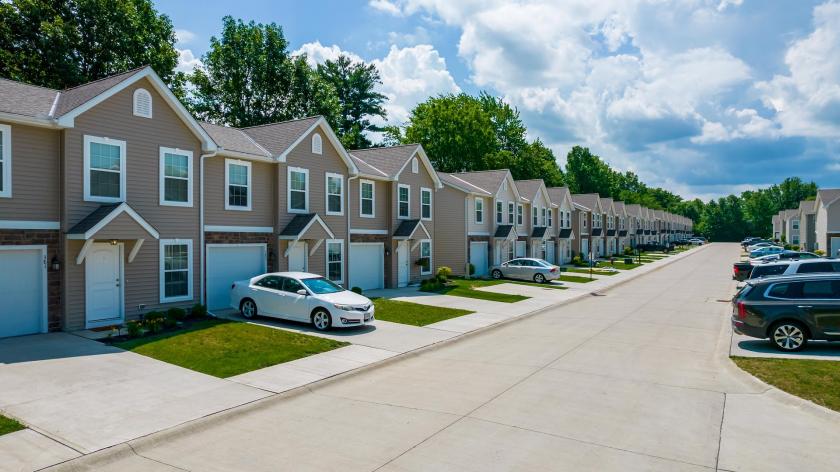
Concord Station Townhomes - Station 44 Pl Painesville, OH 44077
Concord Station Townhomes - Station 44 Pl Painesville, OH 44077
Details & Description
Property Highlights
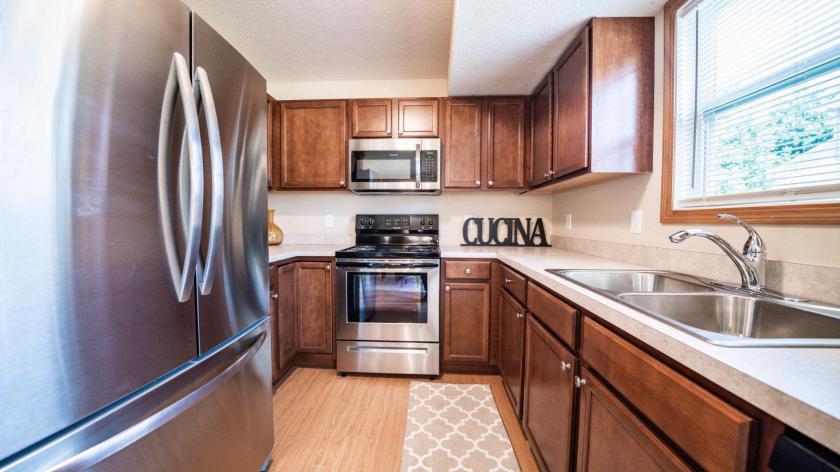
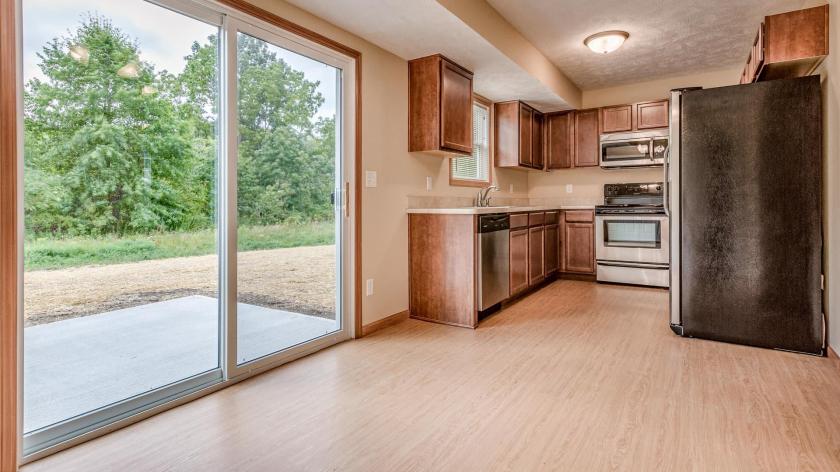
• All Units Feature Attached Garage, In-Suite Laundry, and Individual Private Entrances
• Rents Currently $100 Below Market with 30 Day Lease-Up Upon Each Phase Completion
Listing Agents

Michael Barron
O: 216-264-2016
mbarron@ipausa.com
O: 216-264-2016
mbarron@ipausa.com

Daniel Burkons
Marcus & Millichap
O: 216-264-2018
dburkons@ipausa.com
Marcus & Millichap
O: 216-264-2018
dburkons@ipausa.com

Joshua Wintermute
O: 216-264-2028
jwintermute@ipausa.com
O: 216-264-2028
jwintermute@ipausa.com
While we strive to provide the most accurate information, all listing information, and demographic data, is provided by third-parties. As such, MyEListing will not be responsible for the accuracy of the information. It is strongly recommended that you verify all information with the listing agent, and any relevant agencies, prior to making any decisions.