Retail Space
1300 South York Street Muskogee, OK 74403
1300 South York Street Muskogee, OK 74403
Details & Description
Property Highlights
• Median Household Income has Grown by 35 Percent Since 2000 and Nearly 17 Percent Projected in Five Years
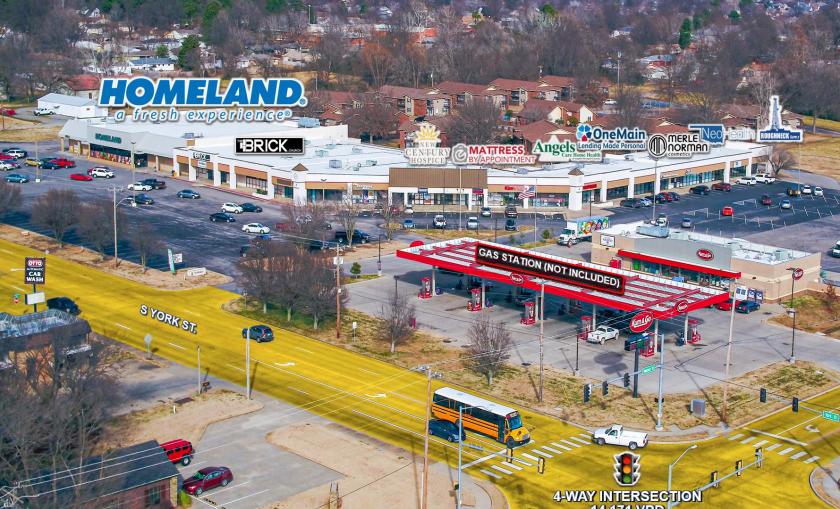
• Signalized Intersection with Dedicated Turn Lanes and C-Store Outparcel Not Included
Listing Agents

Joel Dumes
O: 513-878-7720
joel.dumes@marcusmillichap.com
O: 513-878-7720
joel.dumes@marcusmillichap.com

Christopher Kinnard
Marcus & Millichap
O: 513-878-7743
christopher.kinnard@marcusmillichap.com
Marcus & Millichap
O: 513-878-7743
christopher.kinnard@marcusmillichap.com

Stan Falk
Marcus & Millichap
O: 513-878-7721
stanton.falk@marcusmillichap.com
Marcus & Millichap
O: 513-878-7721
stanton.falk@marcusmillichap.com
While we strive to provide the most accurate information, all listing information, and demographic data, is provided by third-parties. As such, MyEListing will not be responsible for the accuracy of the information. It is strongly recommended that you verify all information with the listing agent, and any relevant agencies, prior to making any decisions.