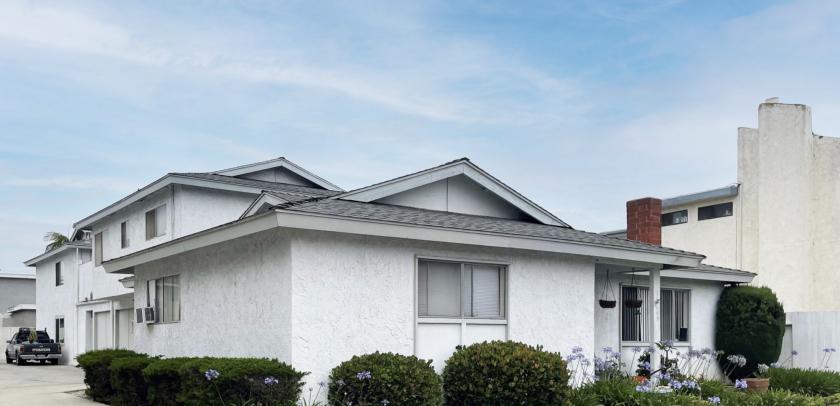
1-Mile | 3-Miles | 5-Miles | ||
---|---|---|---|---|
Total Population | 24,922 | 92,768 | 324,851 | |
Population Median Age | 42 | 42 | 42 | |
Population by Age | 0-9 Yrs | 2264 (9%) | 9395 (10%) | 32127 (9%) |
10-19 Yrs | 2620 (10%) | 10322 (11%) | 36601 (11%) | |
20-29 Yrs | 3229 (12%) | 11230 (12%) | 39234 (12%) | |
30-39 Yrs | 3537 (14%) | 11624 (12%) | 39835 (12%) | |
40-49 Yrs | 2999 (12%) | 11641 (12%) | 42881 (13%) | |
50-59 Yrs | 4001 (16%) | 14828 (15%) | 49735 (15%) | |
60-69 Yrs | 3277 (13%) | 12014 (12%) | 40241 (12%) | |
70+ Yrs | 2994 (12%) | 11714 (12%) | 44198 (13%) | |
Median HH Income | $96,837 | $101,356 | $87,250 | |
Total Household Income | < 24K | 1224 (11%) | 3944 (11%) | 17293 (14%) |
25-49K | 1177 (11%) | 4178 (11%) | 18704 (15%) | |
50-74K | 1309 (12%) | 4546 (12%) | 17187 (14%) | |
75-99K | 1626 (15%) | 4934 (13%) | 15773 (12%) | |
100-199K | 3282 (31%) | 11616 (32%) | 34346 (28%) | |
200K+ | 1642 (16%) | 6447 (18%) | 18524 (15%) | |
Highest Education Level | No Diploma | 1113 | 4384 | 26156 |
Diploma or GED | 2417 | 10185 | 42323 | |
Some College | 4679 | 16250 | 54206 | |
Assoc. Degree | 1751 | 6176 | 20821 | |
Bachelors Degree | 5150 | 18457 | 59996 | |
Higher Degree | 3851 | 12767 | 35866 | |
Total Housing Units | 10,913 | 38,434 | 129,084 | |
--Owner-Occupied | 5,326 | 21,288 | 70,330 | |
--Renter-Occupied | 4,933 | 14,377 | 51,497 | |
Owner-Occupied Values | < 100K | 274 | 720 | 3124 |
100-199K | 229 | 380 | 3242 | |
200-299K | 192 | 457 | 2617 | |
300-399K | 161 | 466 | 2838 | |
400-499K | 405 | 902 | 4175 | |
500K+ | 4064 | 18362 | 54333 | |
Total Working Age Population | 20,978 | 77,146 | 270,487 | |
In Work Force | 14,805 | 51,565 | 170,888 | |
Not In Work Force | 6,173 | 25,582 | 99,598 | |
Workforce Employed | 14,118 | 48,969 | 162,651 | |
Workforce Unemployed | 641 | 2,395 | 7,911 | |
Civlian Workforce | 14,759 | 51,364 | 170,562 | |
Military Workforce | 46 | 201 | 326 | |
Total Households | 10,259 | 35,665 | 121,826 | |
Family Households | 6,142 | 23,778 | 79,891 | |
Non-Family Households | 4,117 | 11,887 | 41,935 | |
Married Couple | 4,812 | 18,636 | 60,607 | |
Other Family | 1,330 | 5,142 | 19,285 | |
Married w/Child | 1,817 | 6,889 | 22,095 | |
Single Male w/Child | 168 | 727 | 2,134 | |
Single Female w/Child | 358 | 1,414 | 5,592 |
Population Change Last Two Decades - Plus Projection
2000 | % | 2010 | % | 2020 | % | 2030 | |
---|---|---|---|---|---|---|---|
California | 33,871,648 | +10 | 37,253,956 | +9 | 40,467,295 | +8 | 43,631,295 |
Los Angeles County | 9,519,338 | +3 | 9,818,605 | +6 | 10,369,367 | +4 | 10,759,850 |
Orange County | 2,846,289 | +6 | 3,010,232 | +8 | 3,257,087 | +5 | 3,431,096 |
Total Working Age Population:
Total Households:
Total Working Age Population:
Total Households:
Total Working Age Population:
Total Households: