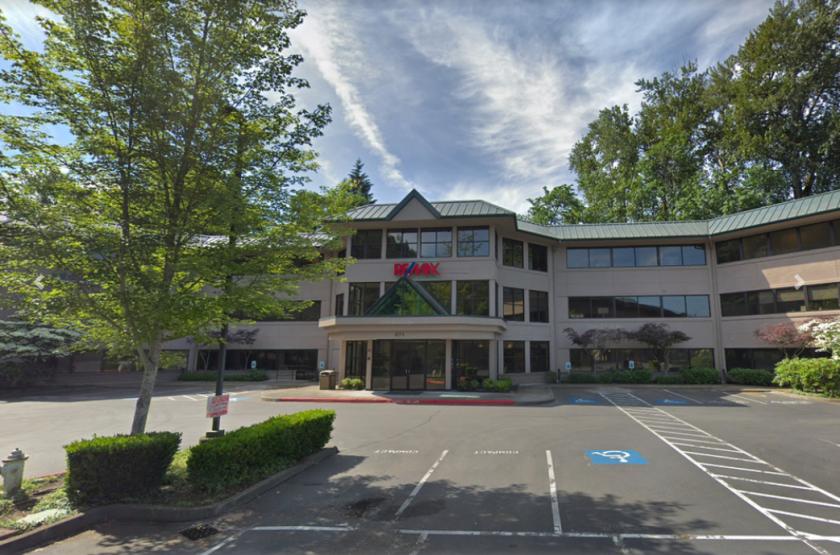
Office Space
371 Northeast Gilman Boulevard Issaquah, WA 98027
371 Northeast Gilman Boulevard Issaquah, WA 98027
Details & Description
Property Highlights
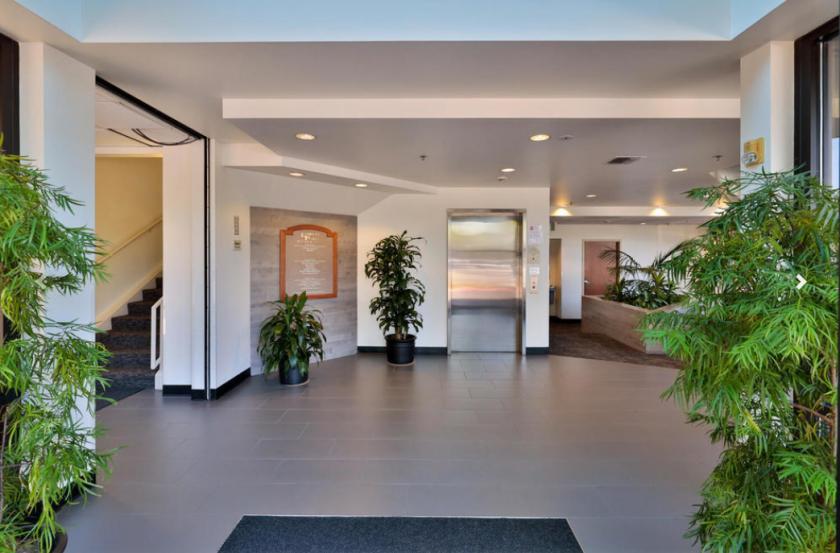
• Well maintained building served by an elevator
• 2021 Nets of $9.54sf
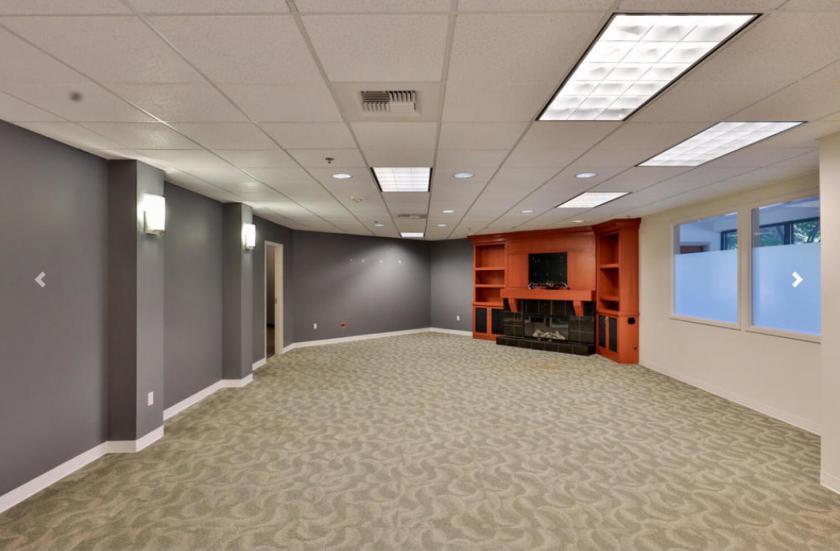
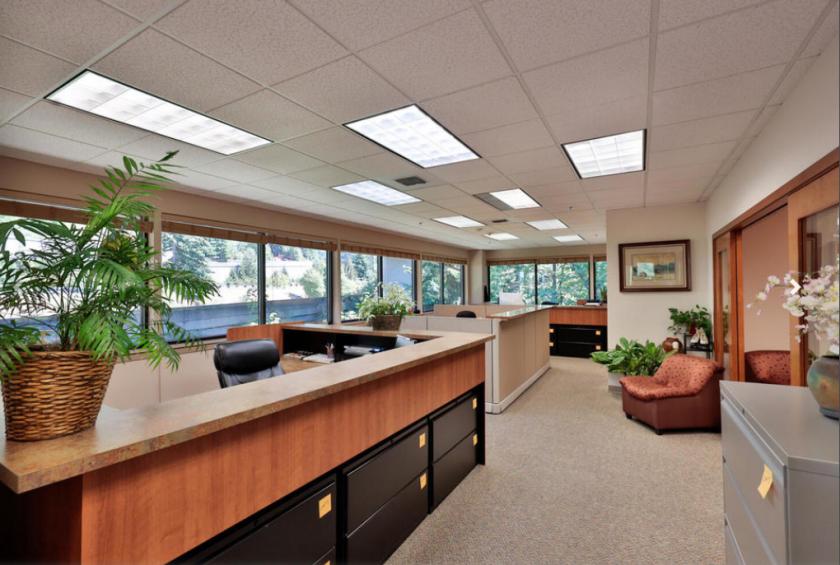
Additional Photos
Listing Agents

Aaron Mathieu
O: 206-210-5207
M: 206-948-4670
amathieu@lee-associates.com
O: 206-210-5207
M: 206-948-4670
amathieu@lee-associates.com
While we strive to provide the most accurate information, all listing information, and demographic data, is provided by third-parties. As such, MyEListing will not be responsible for the accuracy of the information. It is strongly recommended that you verify all information with the listing agent, and any relevant agencies, prior to making any decisions.