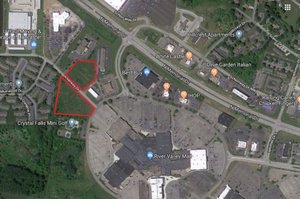
1-Mile | 3-Miles | 5-Miles | ||
---|---|---|---|---|
Total Population | 5,435 | 42,470 | 129,784 | |
Population Median Age | 34 | 35 | 36 | |
Population by Age | 0-9 Yrs | 939 (17%) | 6701 (15%) | 20029 (15%) |
10-19 Yrs | 823 (15%) | 6459 (15%) | 18890 (14%) | |
20-29 Yrs | 557 (10%) | 4374 (10%) | 14001 (10%) | |
30-39 Yrs | 767 (14%) | 6758 (15%) | 20448 (15%) | |
40-49 Yrs | 1011 (18%) | 7446 (17%) | 20328 (15%) | |
50-59 Yrs | 565 (10%) | 4942 (11%) | 15530 (11%) | |
60-69 Yrs | 459 (8%) | 3259 (7%) | 11419 (8%) | |
70+ Yrs | 314 (5%) | 2532 (5%) | 9139 (7%) | |
Median HH Income | $108,062 | $114,480 | $106,797 | |
Total Household Income | < 24K | 79 (4%) | 625 (4%) | 2809 (5%) |
25-49K | 320 (16%) | 1867 (12%) | 5705 (12%) | |
50-74K | 270 (13%) | 1936 (12%) | 7073 (15%) | |
75-99K | 217 (11%) | 1965 (13%) | 6227 (13%) | |
100-199K | 773 (39%) | 5832 (38%) | 17176 (36%) | |
200K+ | 282 (14%) | 2825 (18%) | 7914 (16%) | |
Highest Education Level | No Diploma | 61 | 702 | 1773 |
Diploma or GED | 317 | 3058 | 10542 | |
Some College | 644 | 4060 | 13757 | |
Assoc. Degree | 226 | 1574 | 5486 | |
Bachelors Degree | 1298 | 10683 | 32283 | |
Higher Degree | 861 | 7299 | 20789 | |
Total Housing Units | 1,989 | 15,824 | 49,246 | |
--Owner-Occupied | 1,473 | 11,355 | 34,563 | |
--Renter-Occupied | 467 | 3,694 | 12,341 | |
Owner-Occupied Values | < 100K | 24 | 168 | 1166 |
100-199K | 255 | 1207 | 5896 | |
200-299K | 596 | 3374 | 10659 | |
300-399K | 361 | 3424 | 8783 | |
400-499K | 123 | 1704 | 4270 | |
500K+ | 114 | 1479 | 3790 | |
Total Working Age Population | 3,910 | 31,407 | 97,182 | |
In Work Force | 2,897 | 22,967 | 71,483 | |
Not In Work Force | 1,013 | 8,440 | 25,700 | |
Workforce Employed | 2,763 | 22,334 | 69,420 | |
Workforce Unemployed | 134 | 630 | 1,994 | |
Civlian Workforce | 2,897 | 22,964 | 71,415 | |
Military Workforce | 0 | 2 | 68 | |
Total Households | 1,940 | 15,049 | 46,904 | |
Family Households | 1,499 | 11,578 | 34,284 | |
Non-Family Households | 441 | 3,471 | 12,620 | |
Married Couple | 1,234 | 9,814 | 28,984 | |
Other Family | 265 | 1,764 | 5,299 | |
Married w/Child | 765 | 5,940 | 15,996 | |
Single Male w/Child | 54 | 301 | 814 | |
Single Female w/Child | 160 | 783 | 2,503 |
Population Change Last Two Decades - Plus Projection
2000 | % | 2010 | % | 2020 | % | 2030 | |
---|---|---|---|---|---|---|---|
Ohio | 11,353,140 | +2 | 11,536,504 | 0 | 11,574,870 | 0 | 11,615,100 |
Delaware County | 109,989 | +58 | 174,214 | +21 | 210,630 | +17 | 246,000 |
Franklin County | 1,068,978 | +9 | 1,163,414 | +11 | 1,291,320 | +8 | 1,394,980 |
Total Working Age Population:
Total Households:
Total Working Age Population:
Total Households:
Total Working Age Population:
Total Households: