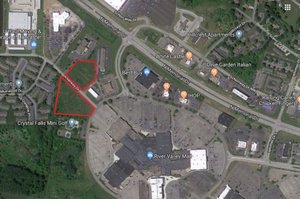
By signing in, you agree with: Terms & Conditions, Privacy Policy and Copyright


20.96 Acres located southwest of Delaware, OH. Perfect site for a neighborhood retail center or food service.
| Month | Payment | Principal | Interest | Total Interest | Balance |
|---|---|---|---|---|---|
| $0.00 | $0.00 | $0.00 | $0.00 | $0.00 | $0.00 |
All information based on the most recently available data (updated annually) and is provided in 1-mile, 3-mile, and 5-mile radii (radiuses) of the property location.
| Total Population | 667 | 12,616 | 50,553 | |
| Population Median Age | 44 | 38 | 37 | |
| Population by Age | 0-9 Yrs | 43 (6%) | 1606 (12%) | 6901 (13%) |
| 10-19 Yrs | 83 (12%) | 1930 (15%) | 7409 (14%) | |
| 20-29 Yrs | 76 (11%) | 1358 (10%) | 6381 (12%) | |
| 30-39 Yrs | 51 (7%) | 1551 (12%) | 6993 (13%) | |
| 40-49 Yrs | 120 (17%) | 2110 (16%) | 7065 (13%) | |
| 50-59 Yrs | 125 (18%) | 1662 (13%) | 6678 (13%) | |
| 60-69 Yrs | 76 (11%) | 1139 (9%) | 4666 (9%) | |
| 70+ Yrs | 93 (13%) | 1260 (9%) | 4460 (8%) | |
| Median HH Income | $105,158 | $89,100 | $82,085 | |
| Total Household Income | < 24K | 17 (7%) | 366 (8%) | 2389 (13%) |
| 25-49K | 27 (11%) | 779 (17%) | 3213 (18%) | |
| 50-74K | 41 (17%) | 607 (13%) | 2614 (14%) | |
| 75-99K | 25 (10%) | 761 (17%) | 2433 (13%) | |
| 100-199K | 98 (42%) | 1473 (33%) | 5241 (29%) | |
| 200K+ | 23 (10%) | 376 (8%) | 1921 (10%) | |
| Highest Education Level | No Diploma | 37 | 537 | 1958 |
| Diploma or GED | 85 | 1835 | 7570 | |
| Some College | 95 | 1701 | 6777 | |
| Assoc. Degree | 57 | 634 | 2431 | |
| Bachelors Degree | 146 | 2319 | 9215 | |
| Higher Degree | 65 | 1217 | 4573 | |
| Total Housing Units | 249 | 4,619 | 18,757 | |
| --Owner-Occupied | 198 | 3,491 | 12,639 | |
| --Renter-Occupied | 32 | 870 | 5,174 | |
| Owner-Occupied Values | < 100K | 12 | 187 | 1029 |
| 100-199K | 29 | 1149 | 4144 | |
| 200-299K | 40 | 1052 | 3345 | |
| 300-399K | 60 | 494 | 2212 | |
| 400-499K | 57 | 408 | 1226 | |
| 500K+ | 0 | 202 | 683 | |
| Total Working Age Population | 554 | 9,845 | 39,396 | |
| In Work Force | 331 | 6,664 | 26,878 | |
| Not In Work Force | 223 | 3,180 | 12,518 | |
| Workforce Employed | 302 | 6,436 | 25,977 | |
| Workforce Unemployed | 28 | 228 | 877 | |
| Civlian Workforce | 331 | 6,664 | 26,854 | |
| Military Workforce | 0 | 1 | 24 | |
| Total Households | 230 | 4,361 | 17,813 | |
| Family Households | 174 | 3,318 | 12,422 | |
| Non-Family Households | 56 | 1,044 | 5,391 | |
| Married Couple | 157 | 2,723 | 9,908 | |
| Other Family | 17 | 594 | 2,514 | |
| Married w/Child | 63 | 1,300 | 4,794 | |
| Single Male w/Child | 2 | 161 | 457 | |
| Single Female w/Child | 0 | 156 | 963 | |
Population Change Last Two Decades - Plus Projection
| 2000 | % | 2010 | % | 2020 | % | 2030 | |
|---|---|---|---|---|---|---|---|
| Ohio | 11,353,140 | +2 | 11,536,504 | 0 | 11,574,870 | 0 | 11,615,100 |
| Delaware County | 109,989 | +58 | 174,214 | +21 | 210,630 | +17 | 246,000 |
| Union County | 40,909 | +28 | 52,300 | +10 | 57,710 | +12 | 64,830 |