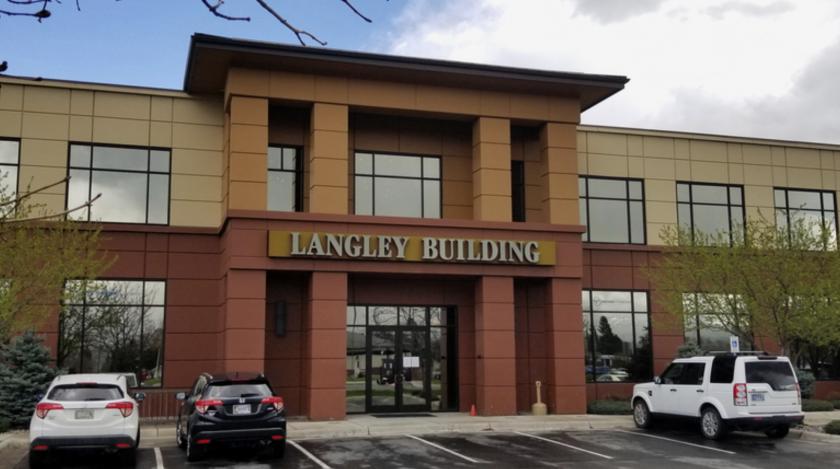
Office Space
203 West Central Avenue Missoula, MT 59801
203 West Central Avenue Missoula, MT 59801
Details & Description
Property Highlights
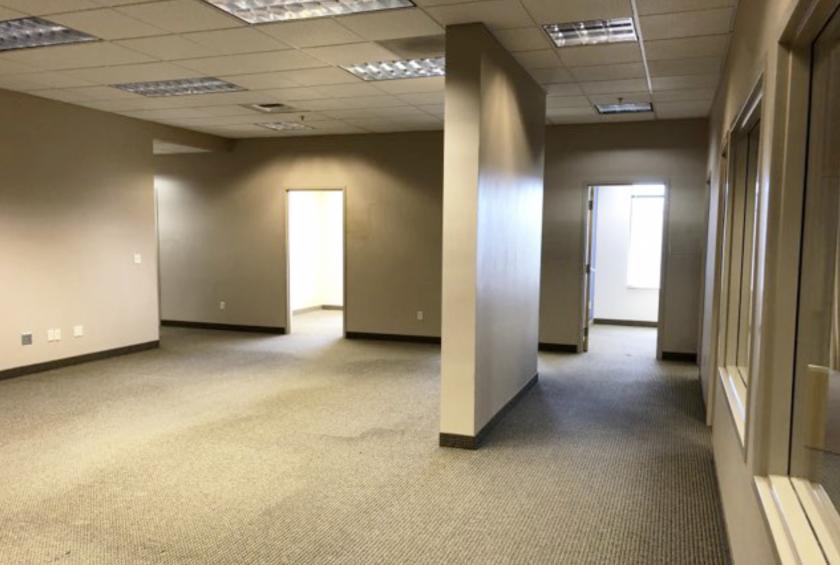
• Flexible built-out space can be demised into two 2 smaller suites
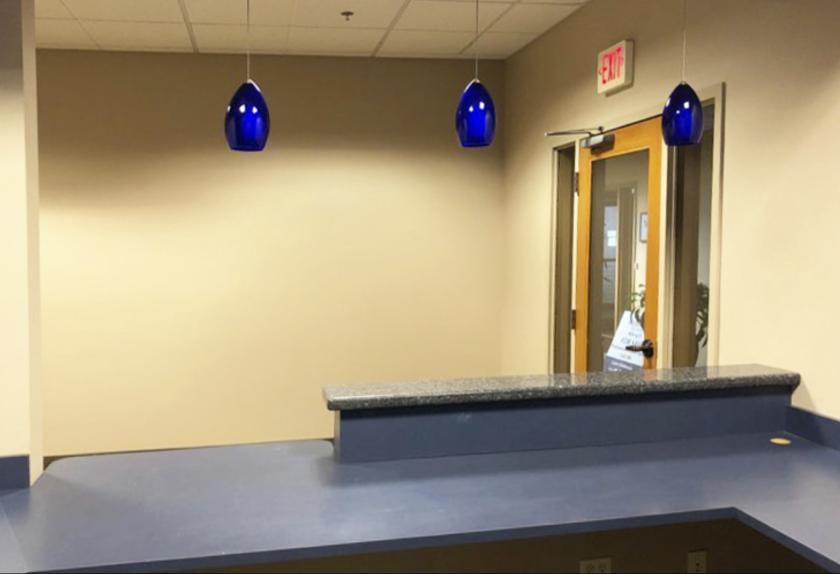
• Current layout works for administrative or medical office use
Listing Agents

Claire Matten
O: 406-360-3102
claire@sterlingcreadvisors.com
O: 406-360-3102
claire@sterlingcreadvisors.com
While we strive to provide the most accurate information, all listing information, and demographic data, is provided by third-parties. As such, MyEListing will not be responsible for the accuracy of the information. It is strongly recommended that you verify all information with the listing agent, and any relevant agencies, prior to making any decisions.