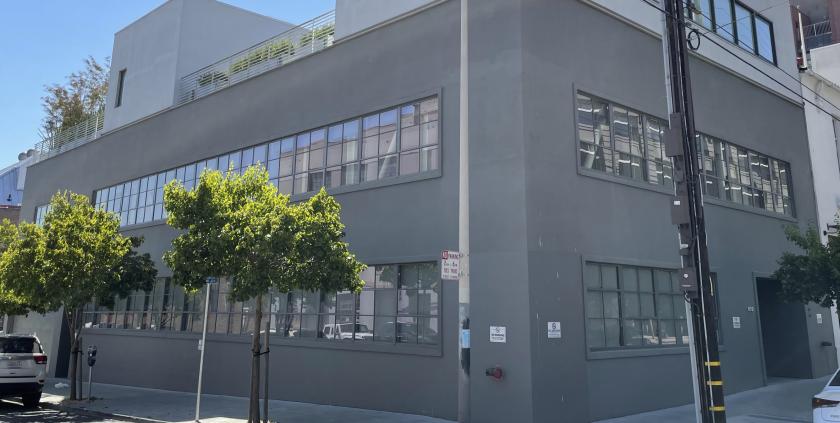
Office Space
850 Battery Street San Francisco, CA 94111
850 Battery Street San Francisco, CA 94111
Details & Description
Property Highlights
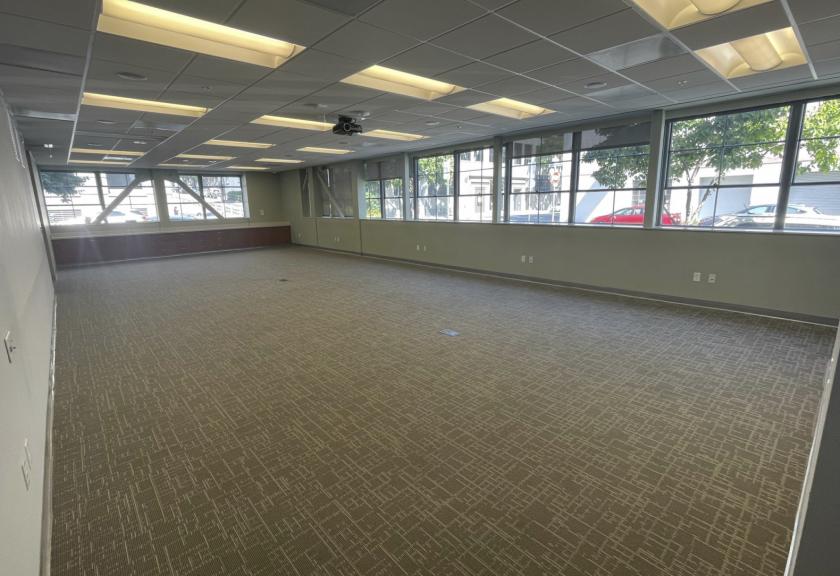
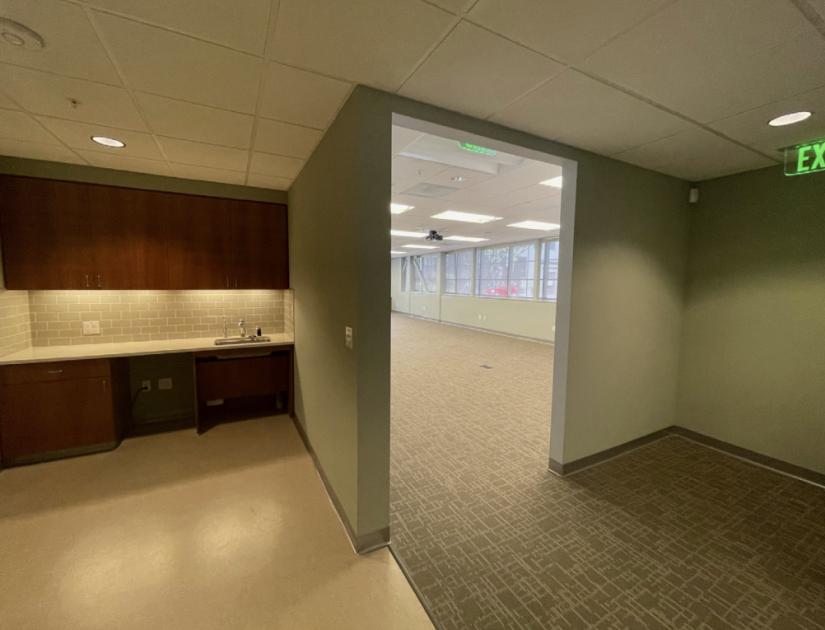
- • Open Plan
- • Great Natural light
- • Large window line
- • One Conference Room
- • One IT room
- • Embarcadero Location
Listing Agents

Jay Cahan
O: 415-865-6102
M: 415-867-4040
jcahan@hcmcommercial.com
O: 415-865-6102
M: 415-867-4040
jcahan@hcmcommercial.com
While we strive to provide the most accurate information, all listing information, and demographic data, is provided by third-parties. As such, MyEListing will not be responsible for the accuracy of the information. It is strongly recommended that you verify all information with the listing agent, and any relevant agencies, prior to making any decisions.