Specialty Real Estate
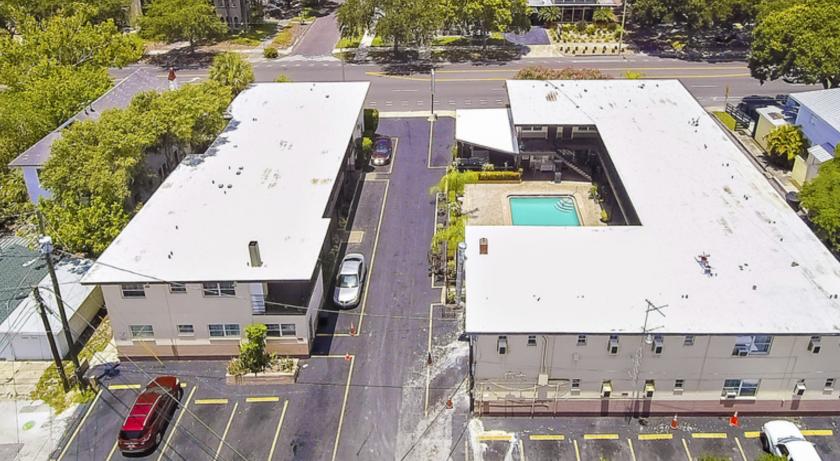
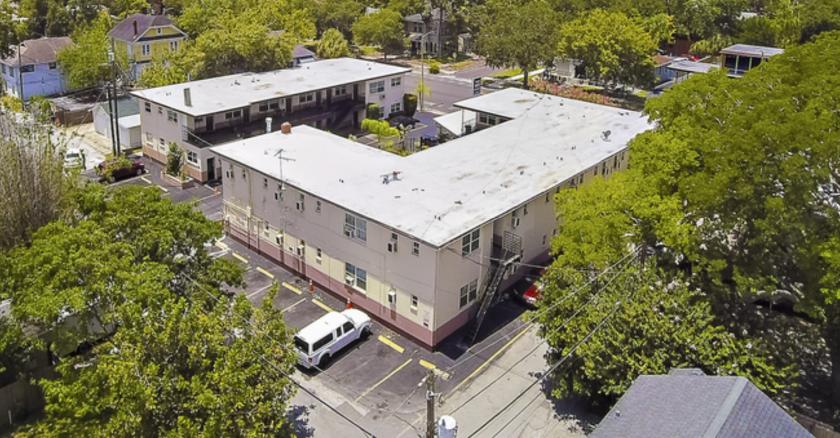
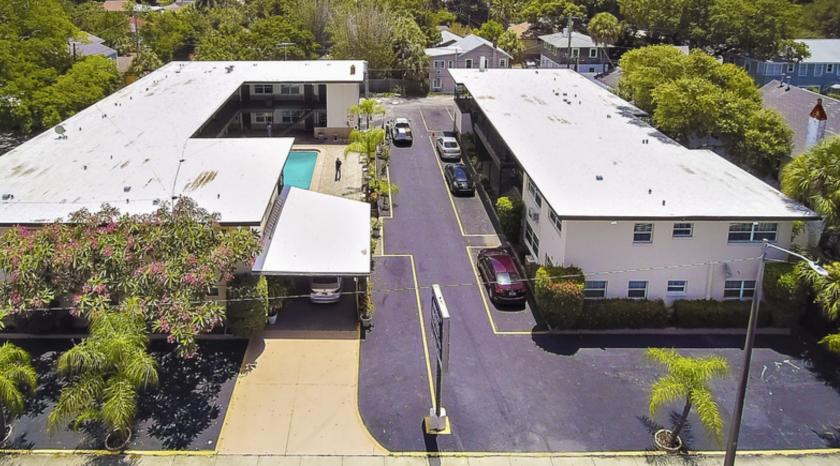
1501 Doctor Martin Luther King Junior Street North St Petersburg, FL 33704
1501 Doctor Martin Luther King Junior Street North St Petersburg, FL 33704
Details & Description
Listing Agents

Jake Wollman
KW Commercial
O: 727-280-5592
M: 239-272-7006
jwollman@kwcommercial.com
KW Commercial
O: 727-280-5592
M: 239-272-7006
jwollman@kwcommercial.com
While we strive to provide the most accurate information, all listing information, and demographic data, is provided by third-parties. As such, MyEListing will not be responsible for the accuracy of the information. It is strongly recommended that you verify all information with the listing agent, and any relevant agencies, prior to making any decisions.