Office Space
1032 Tamiami Trail Port Charlotte, FL 33953
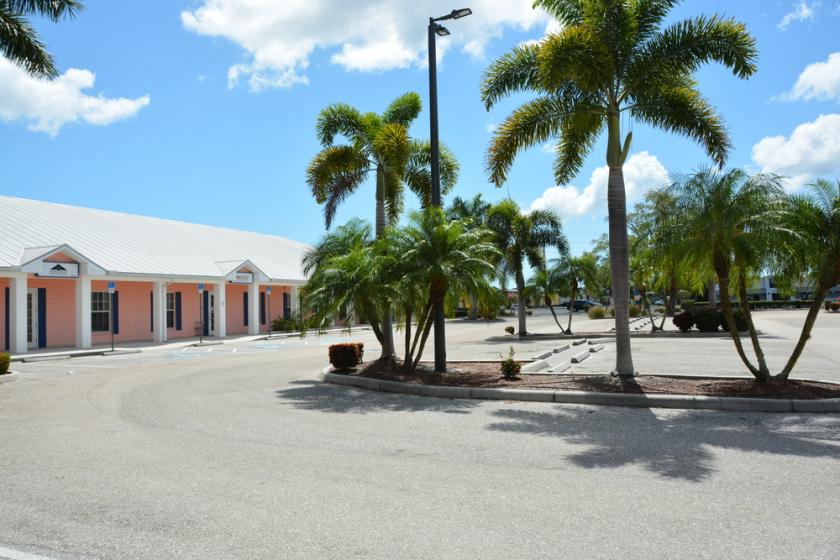
1032 Tamiami Trail Port Charlotte, FL 33953

Details & Description
Property Highlights
- • Great Location in Charlotte Countys Business Hub
- • Convenient to North Port Port Charlotte
- • Easy Access from US-41 Sherbourne St
- • Ample Parking
Listing Agents

Jim Quinn
KW Commercial
O: 941-875-9060
M: 941-457-1380
jquinn@kw.com
KW Commercial
O: 941-875-9060
M: 941-457-1380
jquinn@kw.com
While we strive to provide the most accurate information, all listing information, and demographic data, is provided by third-parties. As such, MyEListing will not be responsible for the accuracy of the information. It is strongly recommended that you verify all information with the listing agent, and any relevant agencies, prior to making any decisions.