Office Space
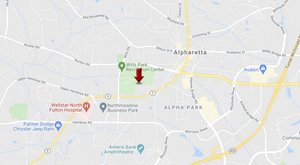
1810 Mulkey Road Austell, GA 30106
1810 Mulkey Road Austell, GA 30106

Details & Description
Property Highlights
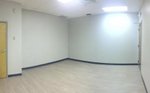
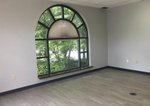
• Great office space, lobby level at The Medical Arts Building at Cobb Hospital.
• Well maintained building with good parking easy egressingress.
Listing Agents

Adriana West
KW Commercial
M: 404-531-5700
west.adriana@gmail.com
KW Commercial
M: 404-531-5700
west.adriana@gmail.com
While we strive to provide the most accurate information, all listing information, and demographic data, is provided by third-parties. As such, MyEListing will not be responsible for the accuracy of the information. It is strongly recommended that you verify all information with the listing agent, and any relevant agencies, prior to making any decisions.