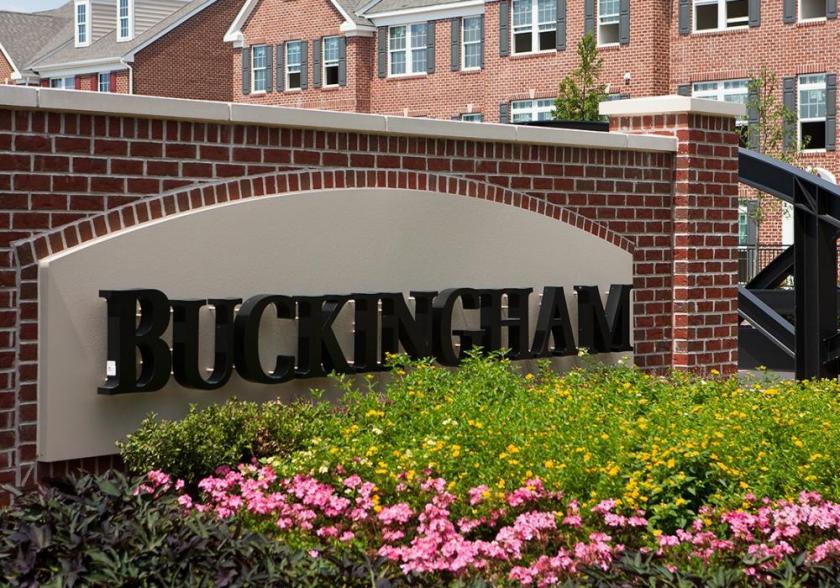
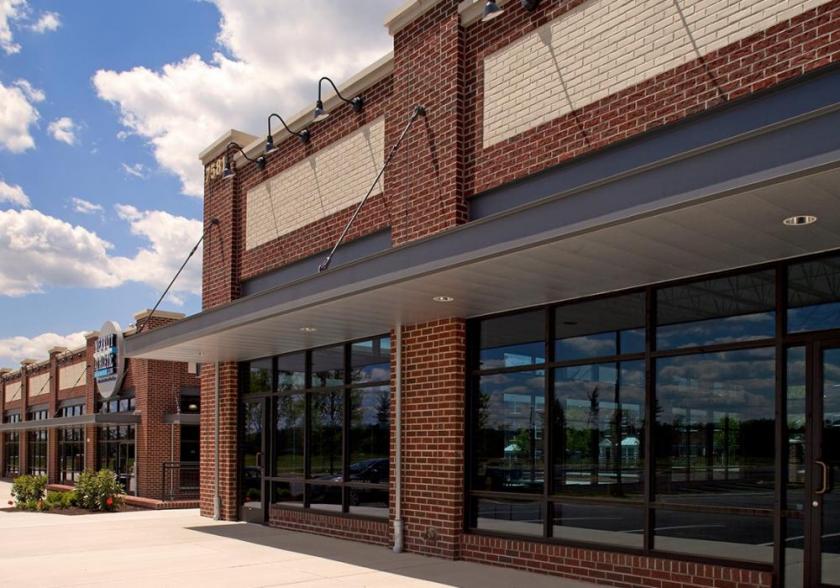
Retail Space
7581 Buckingham Boulevard Hanover, MD 21076
7581 Buckingham Boulevard Hanover, MD 21076
Details & Description
Property Highlights
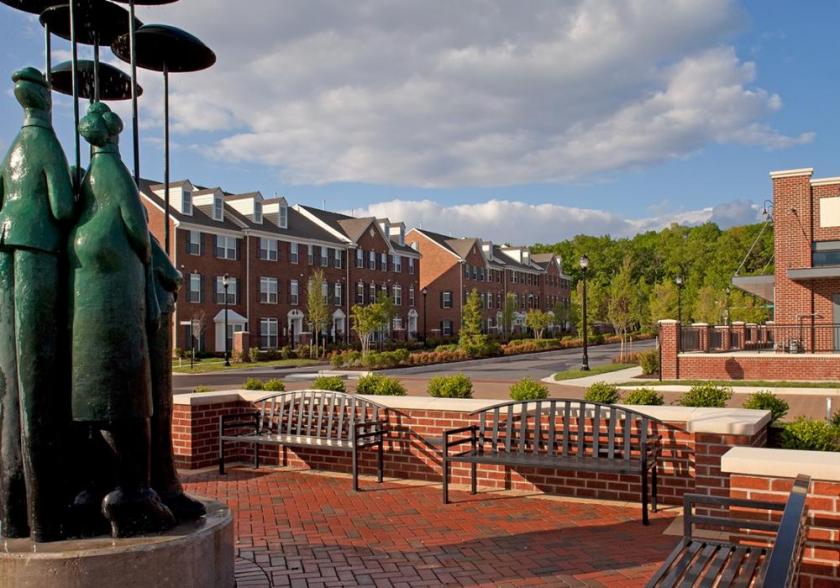
- • MIXED-USE DEVELOPMENT IN ANNE ARUNDEL COUNTY
- • 32-acre site located at Route 100 Route 170
- • 106 single-family garage townhomes
- • 2.5 miles from Arundel Mills Mall
- • 4.5 miles to Fort Meade
Listing Agents

Vince Bagli
O: 410-298-2600
vbagli@merrittproperties.com
O: 410-298-2600
vbagli@merrittproperties.com

Bobby Lanigan
Merritt Properties
O: 919-526-0070
blanigan@merrittproperties.com
Merritt Properties
O: 919-526-0070
blanigan@merrittproperties.com
Jamie Campbell
Merritt Properties
O: 410-298-2600
jcampbell@merrittproperties.com
Merritt Properties
O: 410-298-2600
jcampbell@merrittproperties.com
While we strive to provide the most accurate information, all listing information, and demographic data, is provided by third-parties. As such, MyEListing will not be responsible for the accuracy of the information. It is strongly recommended that you verify all information with the listing agent, and any relevant agencies, prior to making any decisions.