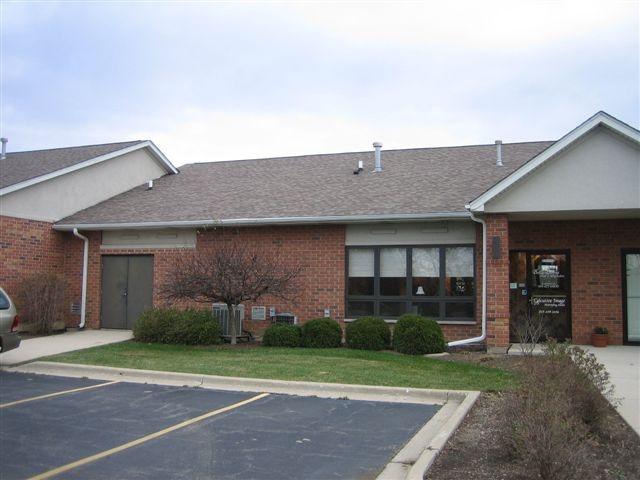
1-Mile | 3-Miles | 5-Miles | ||
---|---|---|---|---|
Total Population | 3,283 | 34,168 | 103,362 | |
Population Median Age | 41 | 39 | 39 | |
Population by Age | 0-9 Yrs | 336 (10%) | 4017 (11%) | 12109 (11%) |
10-19 Yrs | 525 (15%) | 4832 (14%) | 13712 (13%) | |
20-29 Yrs | 265 (8%) | 4087 (11%) | 12469 (12%) | |
30-39 Yrs | 332 (10%) | 4110 (12%) | 12820 (12%) | |
40-49 Yrs | 436 (13%) | 4476 (13%) | 13716 (13%) | |
50-59 Yrs | 667 (20%) | 5823 (17%) | 18149 (17%) | |
60-69 Yrs | 408 (12%) | 3684 (10%) | 11548 (11%) | |
70+ Yrs | 315 (9%) | 3139 (9%) | 8839 (8%) | |
Median HH Income | $97,145 | $89,935 | $89,802 | |
Total Household Income | < 24K | 99 (8%) | 1192 (9%) | 3058 (8%) |
25-49K | 161 (13%) | 2069 (16%) | 5894 (15%) | |
50-74K | 172 (14%) | 1927 (15%) | 6558 (17%) | |
75-99K | 176 (14%) | 1770 (14%) | 5912 (15%) | |
100-199K | 427 (36%) | 4203 (33%) | 12637 (33%) | |
200K+ | 141 (11%) | 1330 (10%) | 3963 (10%) | |
Highest Education Level | No Diploma | 131 | 1369 | 3777 |
Diploma or GED | 426 | 5364 | 16799 | |
Some College | 506 | 4645 | 16129 | |
Assoc. Degree | 202 | 2315 | 7089 | |
Bachelors Degree | 693 | 6041 | 18239 | |
Higher Degree | 338 | 3679 | 9003 | |
Total Housing Units | 1,236 | 13,146 | 39,927 | |
--Owner-Occupied | 914 | 9,912 | 30,647 | |
--Renter-Occupied | 263 | 2,579 | 7,374 | |
Owner-Occupied Values | < 100K | 25 | 680 | 1819 |
100-199K | 236 | 2980 | 10746 | |
200-299K | 303 | 3552 | 10972 | |
300-399K | 257 | 1757 | 4392 | |
400-499K | 56 | 531 | 1498 | |
500K+ | 37 | 411 | 1219 | |
Total Working Age Population | 2,603 | 27,064 | 82,790 | |
In Work Force | 1,780 | 19,286 | 59,596 | |
Not In Work Force | 823 | 7,778 | 23,194 | |
Workforce Employed | 1,677 | 18,452 | 57,151 | |
Workforce Unemployed | 103 | 833 | 2,434 | |
Civlian Workforce | 1,780 | 19,286 | 59,585 | |
Military Workforce | 0 | 0 | 11 | |
Total Households | 1,176 | 12,491 | 38,021 | |
Family Households | 911 | 9,096 | 28,200 | |
Non-Family Households | 265 | 3,394 | 9,822 | |
Married Couple | 817 | 7,499 | 23,206 | |
Other Family | 94 | 1,597 | 4,993 | |
Married w/Child | 356 | 3,078 | 9,322 | |
Single Male w/Child | 8 | 225 | 739 | |
Single Female w/Child | 21 | 644 | 1,986 |
Population Change Last Two Decades - Plus Projection
2000 | % | 2010 | % | 2020 | % | 2030 | |
---|---|---|---|---|---|---|---|
Illinois | 12,419,293 | +3 | 12,830,632 | +12 | 14,316,487 | +6 | 15,138,849 |
Lake County | 644,356 | +9 | 703,462 | +17 | 820,250 | +6 | 873,024 |
McHenry County | 260,077 | +19 | 308,760 | +32 | 407,931 | +9 | 443,398 |
Total Working Age Population:
Total Households:
Total Working Age Population:
Total Households:
Total Working Age Population:
Total Households: