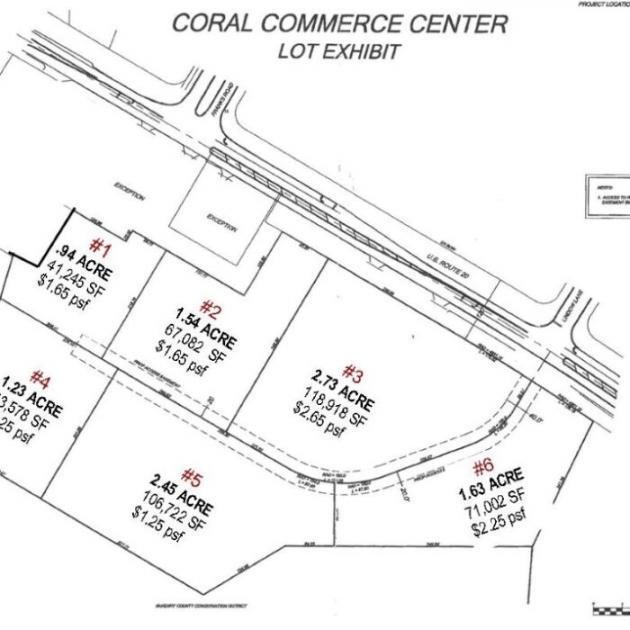
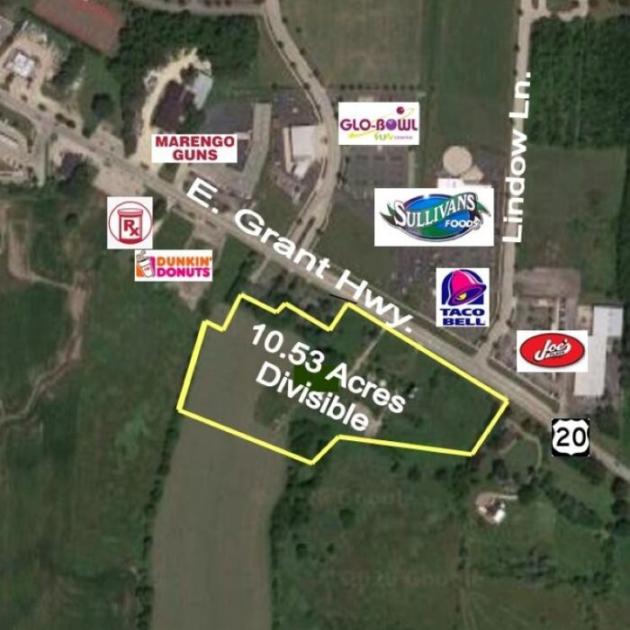
1-Mile | 3-Miles | 5-Miles | ||
---|---|---|---|---|
Total Population | 1,906 | 8,698 | 12,417 | |
Population Median Age | 37 | 38 | 39 | |
Population by Age | 0-9 Yrs | 298 (15%) | 1239 (14%) | 1621 (13%) |
10-19 Yrs | 255 (13%) | 1158 (13%) | 1671 (13%) | |
20-29 Yrs | 203 (10%) | 1211 (13%) | 1497 (12%) | |
30-39 Yrs | 227 (11%) | 930 (10%) | 1291 (10%) | |
40-49 Yrs | 297 (15%) | 1226 (14%) | 1718 (13%) | |
50-59 Yrs | 301 (15%) | 1280 (14%) | 1866 (15%) | |
60-69 Yrs | 151 (7%) | 834 (9%) | 1487 (11%) | |
70+ Yrs | 174 (9%) | 819 (9%) | 1265 (10%) | |
Median HH Income | $83,990 | $74,532 | $83,008 | |
Total Household Income | < 24K | 86 (13%) | 496 (15%) | 599 (13%) |
25-49K | 77 (11%) | 553 (17%) | 770 (17%) | |
50-74K | 119 (18%) | 537 (17%) | 693 (15%) | |
75-99K | 118 (18%) | 413 (13%) | 560 (12%) | |
100-199K | 209 (32%) | 975 (30%) | 1503 (33%) | |
200K+ | 40 (6%) | 176 (5%) | 358 (7%) | |
Highest Education Level | No Diploma | 97 | 442 | 542 |
Diploma or GED | 397 | 1998 | 2810 | |
Some College | 347 | 1388 | 1964 | |
Assoc. Degree | 72 | 401 | 712 | |
Bachelors Degree | 234 | 982 | 1501 | |
Higher Degree | 130 | 515 | 856 | |
Total Housing Units | 685 | 3,319 | 4,788 | |
--Owner-Occupied | 509 | 2,349 | 3,428 | |
--Renter-Occupied | 141 | 802 | 1,056 | |
Owner-Occupied Values | < 100K | 41 | 381 | 438 |
100-199K | 315 | 1259 | 1487 | |
200-299K | 132 | 517 | 897 | |
300-399K | 7 | 129 | 347 | |
400-499K | 14 | 50 | 160 | |
500K+ | 0 | 13 | 99 | |
Total Working Age Population | 1,464 | 6,730 | 9,734 | |
In Work Force | 1,105 | 4,902 | 6,947 | |
Not In Work Force | 359 | 1,828 | 2,788 | |
Workforce Employed | 1,067 | 4,770 | 6,775 | |
Workforce Unemployed | 38 | 132 | 172 | |
Civlian Workforce | 1,105 | 4,902 | 6,947 | |
Military Workforce | 0 | 0 | 0 | |
Total Households | 650 | 3,150 | 4,484 | |
Family Households | 482 | 2,306 | 3,456 | |
Non-Family Households | 168 | 844 | 1,028 | |
Married Couple | 391 | 1,732 | 2,747 | |
Other Family | 91 | 574 | 709 | |
Married w/Child | 169 | 675 | 969 | |
Single Male w/Child | 15 | 126 | 136 | |
Single Female w/Child | 40 | 218 | 270 |
Population Change Last Two Decades - Plus Projection
2000 | % | 2010 | % | 2020 | % | 2030 | |
---|---|---|---|---|---|---|---|
Illinois | 12,419,293 | +3 | 12,830,632 | +12 | 14,316,487 | +6 | 15,138,849 |
McHenry County | 260,077 | +19 | 308,760 | +32 | 407,931 | +9 | 443,398 |
Total Working Age Population:
Total Households:
Total Working Age Population:
Total Households:
Total Working Age Population:
Total Households: