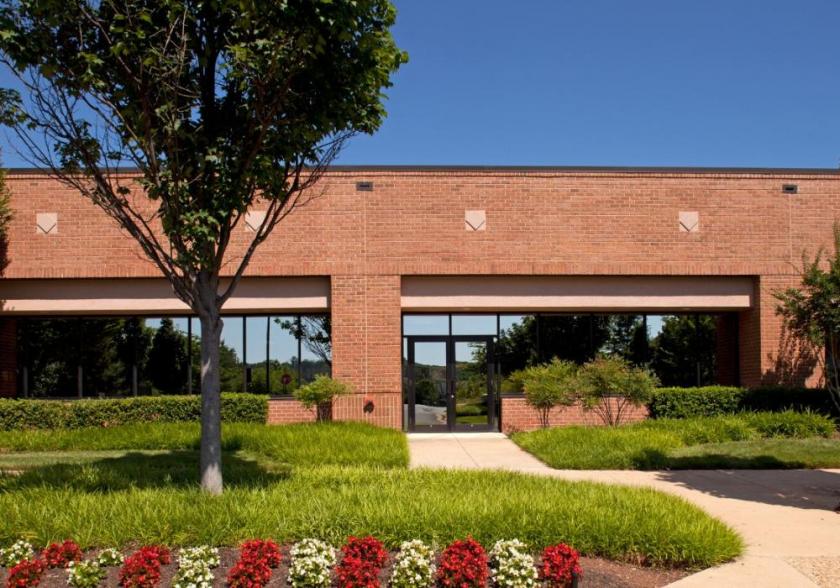
Flex-Office-Warehouse
21630 Ridgetop Circle Sterling, VA 20166
21630 Ridgetop Circle Sterling, VA 20166
Details & Description
Property Highlights
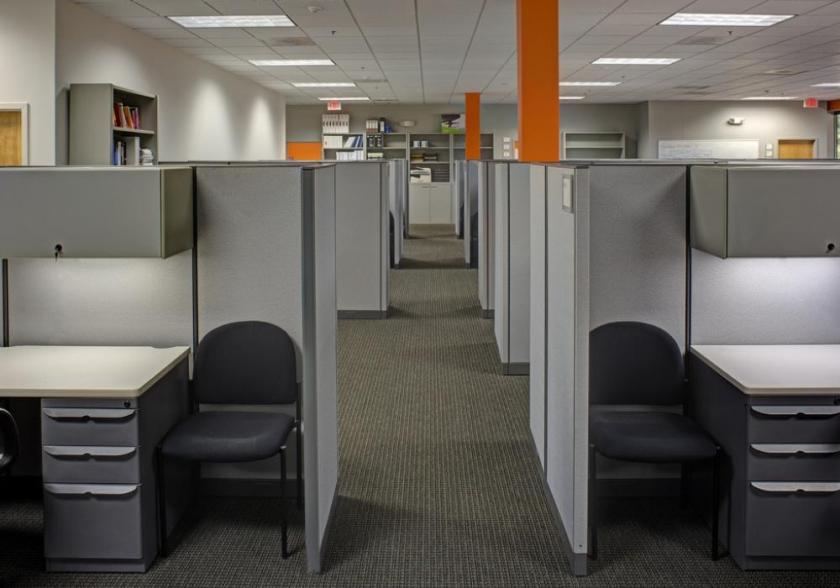
- • Flex buildings feature 10 finished ceiling heights
- • Individually controlled HVAC systems
- • FiOS service available
- • 120208 volt, 3-phase, 4-wire service
- • Gas heatpublic utilities
- • Sprinklered
Listing Agents

Shaelyn Mullaney
O: 919-526-0070
smullaney@merrittproperties.com
O: 919-526-0070
smullaney@merrittproperties.com
While we strive to provide the most accurate information, all listing information, and demographic data, is provided by third-parties. As such, MyEListing will not be responsible for the accuracy of the information. It is strongly recommended that you verify all information with the listing agent, and any relevant agencies, prior to making any decisions.