Office Space
3401 Boston Street Baltimore, MD 21224
3401 Boston Street Baltimore, MD 21224
Details & Description
Property Highlights
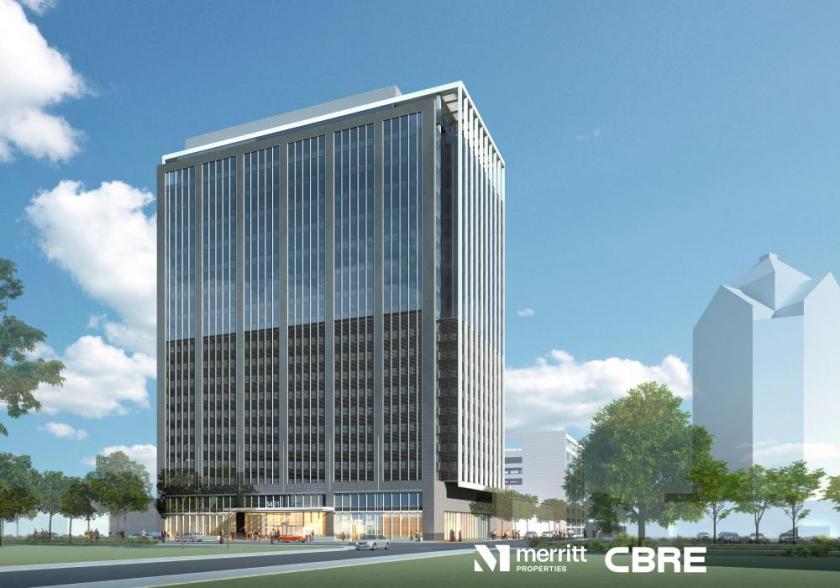
- • 20-story building in Canton
- • 550 free garage parking spots
- • Building signage opportunity, Panoramic city views
- • Located in a Federal HUBZone
- • Intended for LEED Silver certification
- • Easy access to I-95
Listing Agents

Pat Franklin
O: 410-298-2600
pfranklin@merrittproperties.com
O: 410-298-2600
pfranklin@merrittproperties.com
While we strive to provide the most accurate information, all listing information, and demographic data, is provided by third-parties. As such, MyEListing will not be responsible for the accuracy of the information. It is strongly recommended that you verify all information with the listing agent, and any relevant agencies, prior to making any decisions.