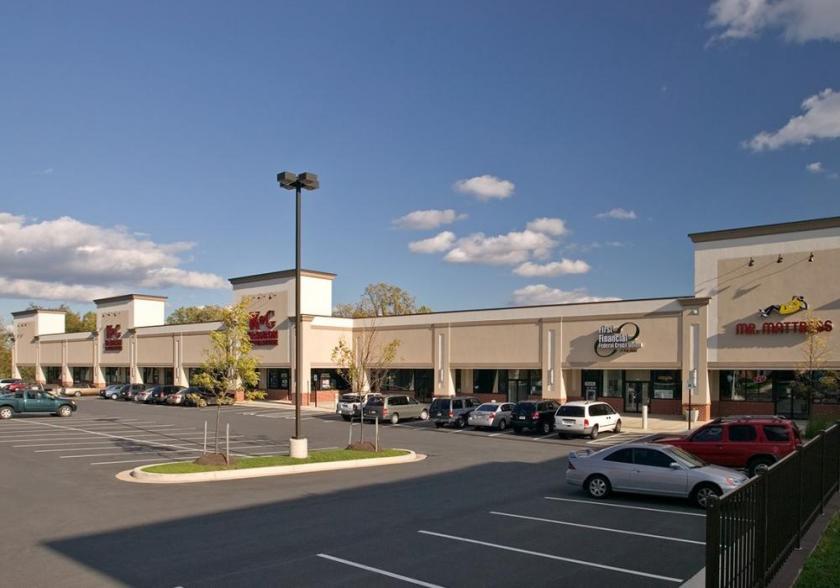
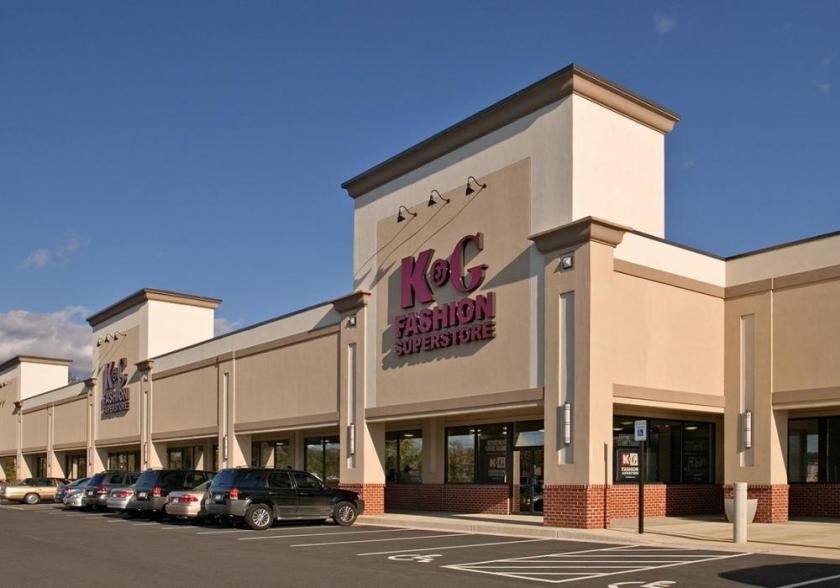
Retail Space
8665 Pulaski Highway Rosedale, MD 21237
8665 Pulaski Highway Rosedale, MD 21237
Details & Description
Property Highlights
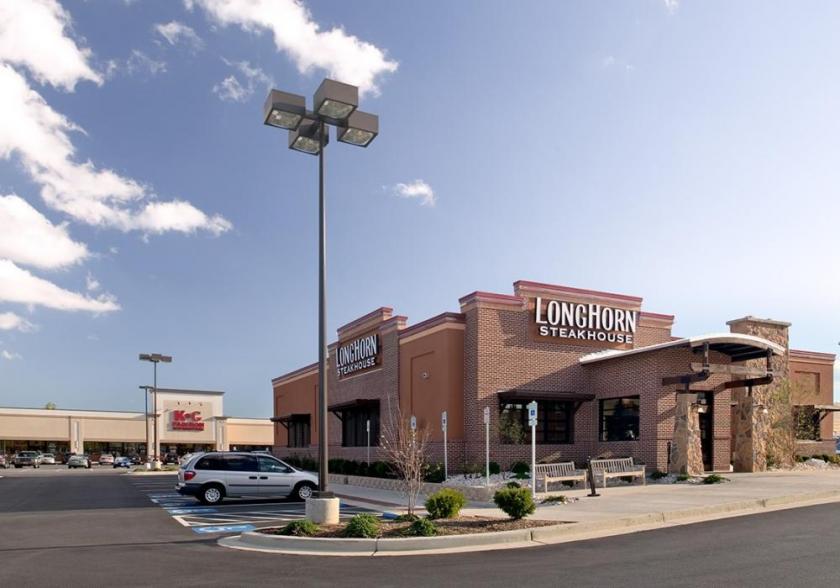
- • Freestanding Longhorn Steakhouse
- • Walk-up ATM
- • 56,775 traffic count on Route 40Pulaski Highway
- • Baltimore County, ML-IM zoning retail
Listing Agents

Ashley Reimer
O: 410-298-2600
areimer@merrittproperties.com
O: 410-298-2600
areimer@merrittproperties.com
While we strive to provide the most accurate information, all listing information, and demographic data, is provided by third-parties. As such, MyEListing will not be responsible for the accuracy of the information. It is strongly recommended that you verify all information with the listing agent, and any relevant agencies, prior to making any decisions.