Industrial Properties
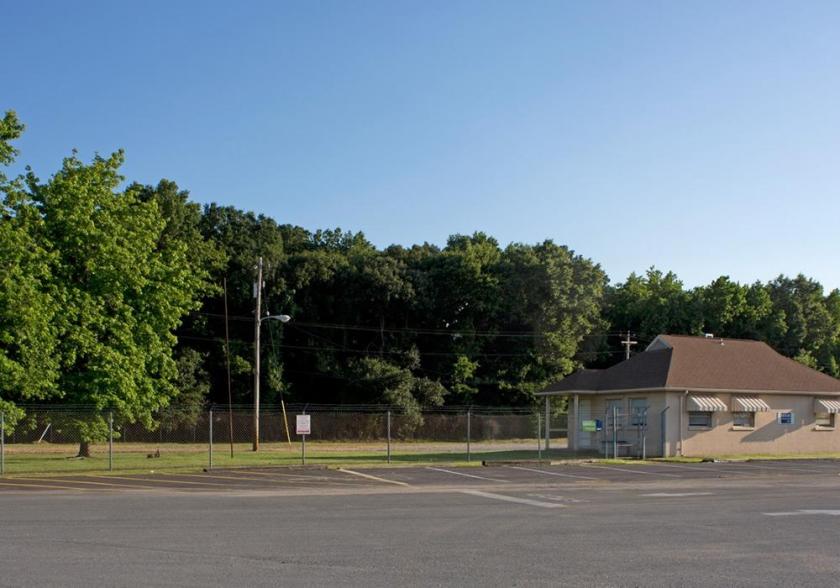
2301 Grays Road Dundalk, MD 21222
2301 Grays Road Dundalk, MD 21222

Details & Description
Property Highlights
- • QUICK ACCESS FROM I-695 AND NORTH POINT BOULEVARD
- • Located in the Chesapeake Enterprise Zone
- • Single-story metal construction
- • 23 acres of exterior land storage
- • 12 to 20 clear ceiling heights
- • Docks and drive-ins
Listing Agents

Ashley Reimer
O: 410-298-2600
areimer@merrittproperties.com
O: 410-298-2600
areimer@merrittproperties.com
While we strive to provide the most accurate information, all listing information, and demographic data, is provided by third-parties. As such, MyEListing will not be responsible for the accuracy of the information. It is strongly recommended that you verify all information with the listing agent, and any relevant agencies, prior to making any decisions.