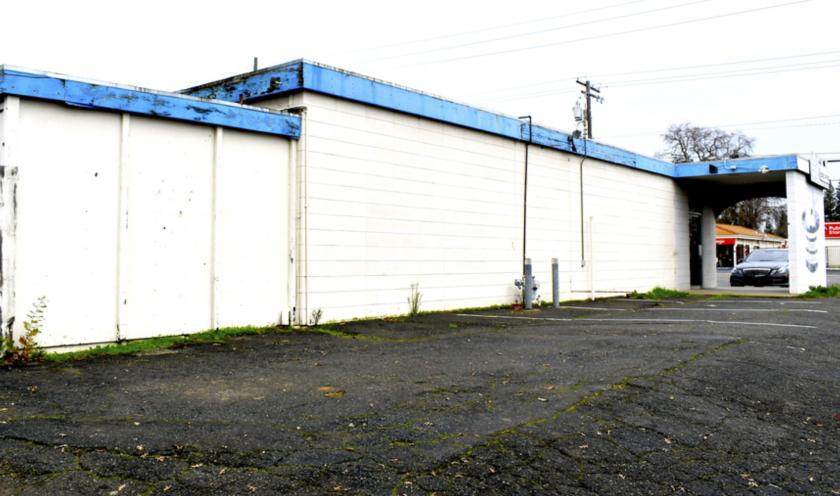
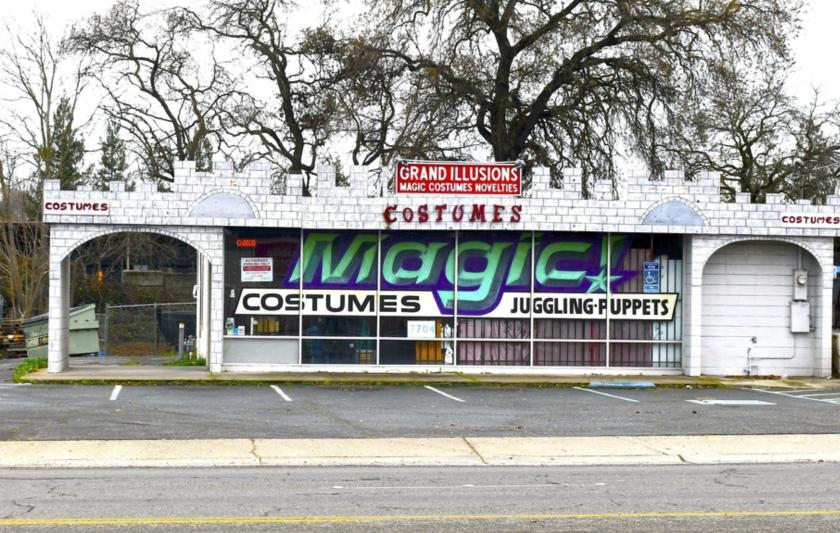
1-Mile | 3-Miles | 5-Miles | ||
---|---|---|---|---|
Total Population | 14,914 | 136,822 | 360,505 | |
Population Median Age | 41 | 40 | 39 | |
Population by Age | 0-9 Yrs | 1765 (11%) | 16204 (11%) | 46612 (12%) |
10-19 Yrs | 1576 (10%) | 15125 (11%) | 42965 (11%) | |
20-29 Yrs | 1808 (12%) | 18325 (13%) | 50882 (14%) | |
30-39 Yrs | 2078 (13%) | 20205 (14%) | 53089 (14%) | |
40-49 Yrs | 1582 (10%) | 15510 (11%) | 40602 (11%) | |
50-59 Yrs | 2298 (15%) | 17949 (13%) | 45486 (12%) | |
60-69 Yrs | 1750 (11%) | 17007 (12%) | 41917 (11%) | |
70+ Yrs | 2057 (13%) | 16498 (12%) | 38952 (10%) | |
Median HH Income | $58,315 | $62,722 | $60,802 | |
Total Household Income | < 24K | 1246 (19%) | 10074 (18%) | 26184 (19%) |
25-49K | 1440 (23%) | 11490 (21%) | 30641 (22%) | |
50-74K | 1075 (17%) | 9950 (18%) | 25402 (18%) | |
75-99K | 799 (12%) | 7390 (13%) | 17865 (13%) | |
100-199K | 1271 (20%) | 11482 (21%) | 28438 (20%) | |
200K+ | 423 (6%) | 3417 (6%) | 8598 (6%) | |
Highest Education Level | No Diploma | 769 | 7528 | 24286 |
Diploma or GED | 2365 | 22586 | 61328 | |
Some College | 2856 | 26967 | 67490 | |
Assoc. Degree | 1513 | 11078 | 25723 | |
Bachelors Degree | 2188 | 18965 | 45985 | |
Higher Degree | 1174 | 10460 | 24261 | |
Total Housing Units | 6,479 | 56,792 | 143,969 | |
--Owner-Occupied | 3,007 | 28,691 | 72,493 | |
--Renter-Occupied | 3,246 | 25,112 | 64,636 | |
Owner-Occupied Values | < 100K | 28 | 1415 | 4584 |
100-199K | 151 | 2382 | 7327 | |
200-299K | 328 | 6449 | 19126 | |
300-399K | 1104 | 9232 | 19900 | |
400-499K | 802 | 4513 | 8814 | |
500K+ | 595 | 4699 | 12741 | |
Total Working Age Population | 12,179 | 111,303 | 287,193 | |
In Work Force | 7,246 | 68,387 | 177,815 | |
Not In Work Force | 4,933 | 42,916 | 109,378 | |
Workforce Employed | 6,923 | 63,701 | 165,743 | |
Workforce Unemployed | 323 | 4,591 | 11,815 | |
Civlian Workforce | 7,246 | 68,291 | 177,558 | |
Military Workforce | 0 | 96 | 257 | |
Total Households | 6,254 | 53,803 | 137,129 | |
Family Households | 3,569 | 33,997 | 87,044 | |
Non-Family Households | 2,685 | 19,806 | 50,085 | |
Married Couple | 2,521 | 23,549 | 58,594 | |
Other Family | 1,048 | 10,448 | 28,450 | |
Married w/Child | 1,054 | 8,801 | 23,970 | |
Single Male w/Child | 118 | 1,360 | 3,926 | |
Single Female w/Child | 336 | 3,717 | 10,517 |
Population Change Last Two Decades - Plus Projection
2000 | % | 2010 | % | 2020 | % | 2030 | |
---|---|---|---|---|---|---|---|
California | 33,871,648 | +10 | 37,253,956 | +9 | 40,467,295 | +8 | 43,631,295 |
Sacramento County | 1,223,499 | +16 | 1,418,788 | +11 | 1,572,195 | +12 | 1,758,565 |
Total Working Age Population:
Total Households:
Total Working Age Population:
Total Households:
Total Working Age Population:
Total Households: