Commercial Land
420 MLK Rd Maysville, KY 41056
420 MLK Rd Maysville, KY 41056
Details & Description
Property Highlights
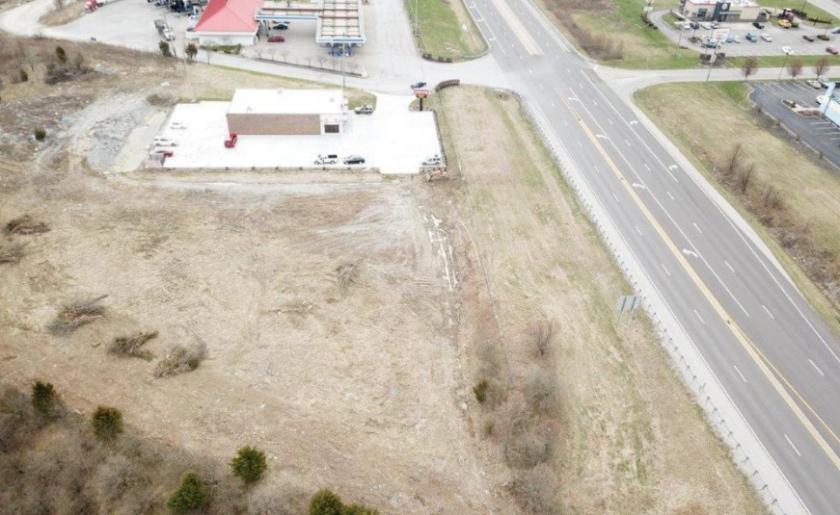
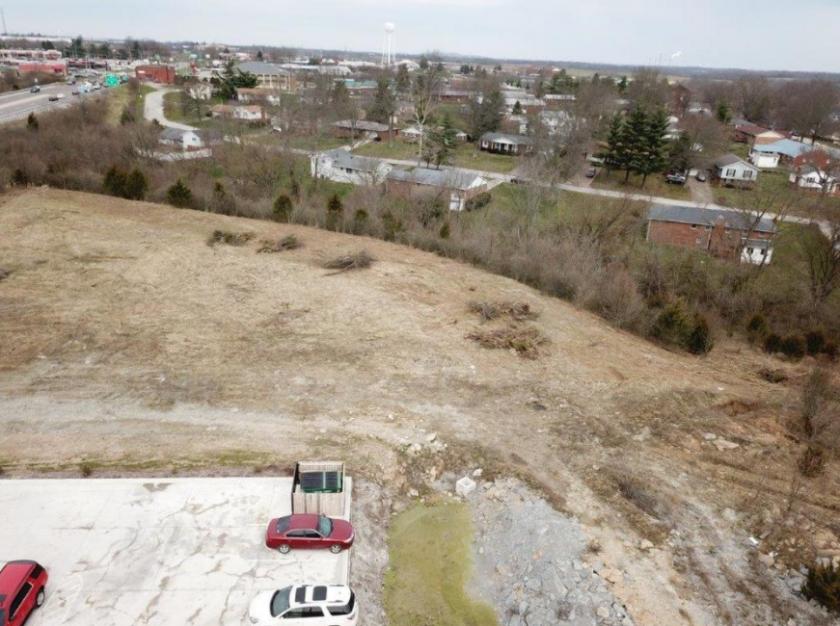
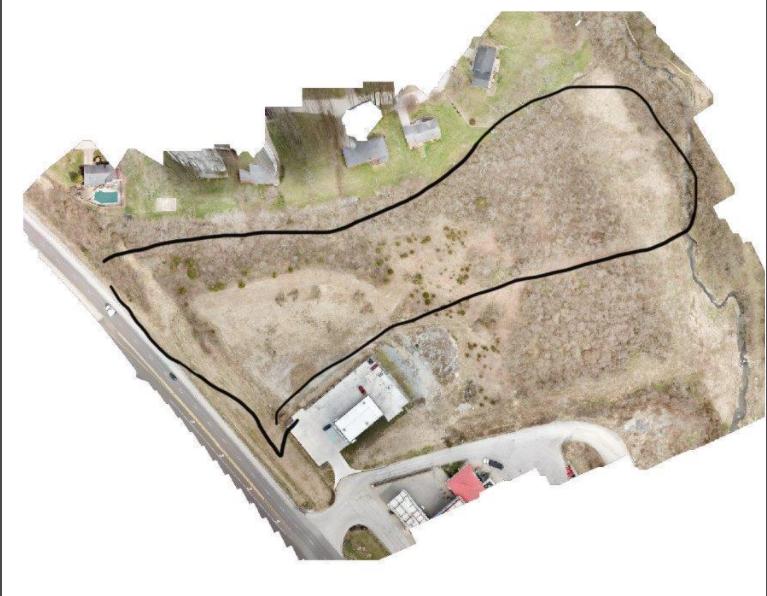
- • Great location
- • Strong visibility
- • High traffic count
Listing Agents

Derrick Plunkett
O: 859-620-5830
dp.kwcommercial@gmail.com
O: 859-620-5830
dp.kwcommercial@gmail.com
While we strive to provide the most accurate information, all listing information, and demographic data, is provided by third-parties. As such, MyEListing will not be responsible for the accuracy of the information. It is strongly recommended that you verify all information with the listing agent, and any relevant agencies, prior to making any decisions.