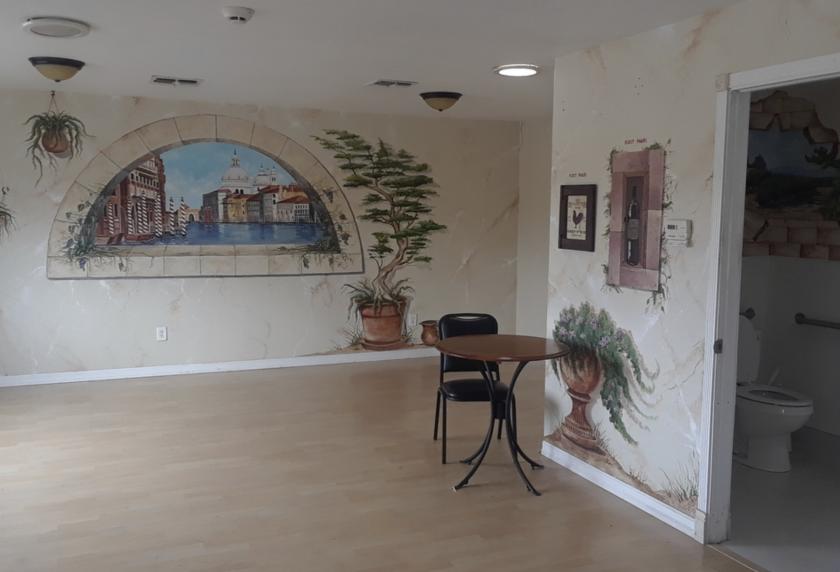
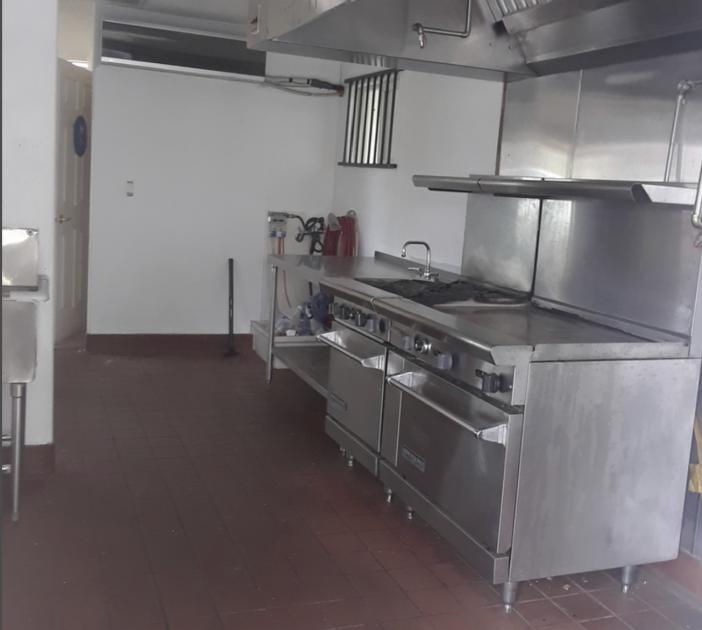
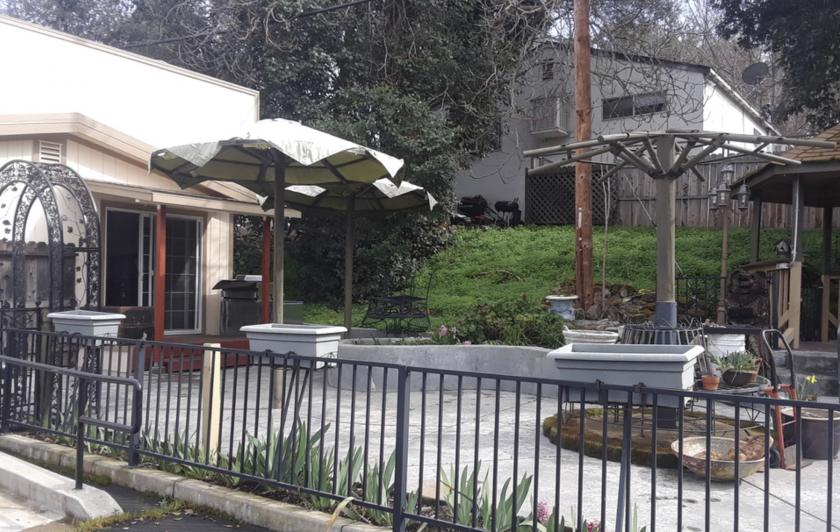
1-Mile | 3-Miles | 5-Miles | ||
---|---|---|---|---|
Total Population | 10,474 | 86,516 | 183,878 | |
Population Median Age | 39 | 40 | 40 | |
Population by Age | 0-9 Yrs | 1257 (12%) | 9837 (11%) | 20523 (11%) |
10-19 Yrs | 1306 (12%) | 10535 (12%) | 23755 (12%) | |
20-29 Yrs | 1424 (13%) | 9881 (11%) | 20057 (10%) | |
30-39 Yrs | 1343 (12%) | 11359 (13%) | 22727 (12%) | |
40-49 Yrs | 1354 (12%) | 13197 (15%) | 26992 (14%) | |
50-59 Yrs | 1709 (16%) | 12981 (15%) | 27905 (15%) | |
60-69 Yrs | 1020 (9%) | 9872 (11%) | 22384 (12%) | |
70+ Yrs | 1061 (10%) | 8854 (10%) | 19534 (10%) | |
Median HH Income | $74,569 | $93,644 | $99,472 | |
Total Household Income | < 24K | 824 (18%) | 3498 (11%) | 6550 (9%) |
25-49K | 737 (16%) | 4612 (14%) | 9147 (13%) | |
50-74K | 673 (15%) | 4594 (14%) | 10140 (14%) | |
75-99K | 631 (14%) | 4276 (13%) | 8287 (12%) | |
100-199K | 1147 (25%) | 10509 (33%) | 22354 (32%) | |
200K+ | 432 (9%) | 4297 (13%) | 11421 (16%) | |
Highest Education Level | No Diploma | 410 | 4580 | 7572 |
Diploma or GED | 1270 | 10311 | 19650 | |
Some College | 2023 | 14254 | 30508 | |
Assoc. Degree | 807 | 6319 | 13861 | |
Bachelors Degree | 1947 | 16794 | 36719 | |
Higher Degree | 900 | 9469 | 22170 | |
Total Housing Units | 4,623 | 32,900 | 70,465 | |
--Owner-Occupied | 2,440 | 21,352 | 48,796 | |
--Renter-Occupied | 2,004 | 10,434 | 19,102 | |
Owner-Occupied Values | < 100K | 70 | 805 | 1600 |
100-199K | 33 | 454 | 710 | |
200-299K | 270 | 1672 | 3685 | |
300-399K | 582 | 4375 | 9830 | |
400-499K | 948 | 5642 | 10571 | |
500K+ | 537 | 8404 | 22400 | |
Total Working Age Population | 8,401 | 70,009 | 148,187 | |
In Work Force | 5,622 | 42,259 | 91,554 | |
Not In Work Force | 2,779 | 27,749 | 56,633 | |
Workforce Employed | 5,477 | 40,523 | 87,749 | |
Workforce Unemployed | 133 | 1,701 | 3,733 | |
Civlian Workforce | 5,609 | 42,224 | 91,482 | |
Military Workforce | 13 | 36 | 72 | |
Total Households | 4,444 | 31,786 | 67,898 | |
Family Households | 2,685 | 21,595 | 48,236 | |
Non-Family Households | 1,759 | 10,191 | 19,662 | |
Married Couple | 1,911 | 17,059 | 38,950 | |
Other Family | 774 | 4,536 | 9,286 | |
Married w/Child | 820 | 7,492 | 16,699 | |
Single Male w/Child | 133 | 817 | 1,515 | |
Single Female w/Child | 328 | 1,430 | 2,781 |
Population Change Last Two Decades - Plus Projection
2000 | % | 2010 | % | 2020 | % | 2030 | |
---|---|---|---|---|---|---|---|
California | 33,871,648 | +10 | 37,253,956 | +9 | 40,467,295 | +8 | 43,631,295 |
El Dorado County | 156,299 | +16 | 181,058 | +6 | 191,581 | +9 | 208,457 |
Placer County | 248,399 | +40 | 348,432 | +15 | 399,388 | +14 | 456,175 |
Sacramento County | 1,223,499 | +16 | 1,418,788 | +11 | 1,572,195 | +12 | 1,758,565 |
Total Working Age Population:
Total Households:
Total Working Age Population:
Total Households:
Total Working Age Population:
Total Households: