Specialty Real Estate
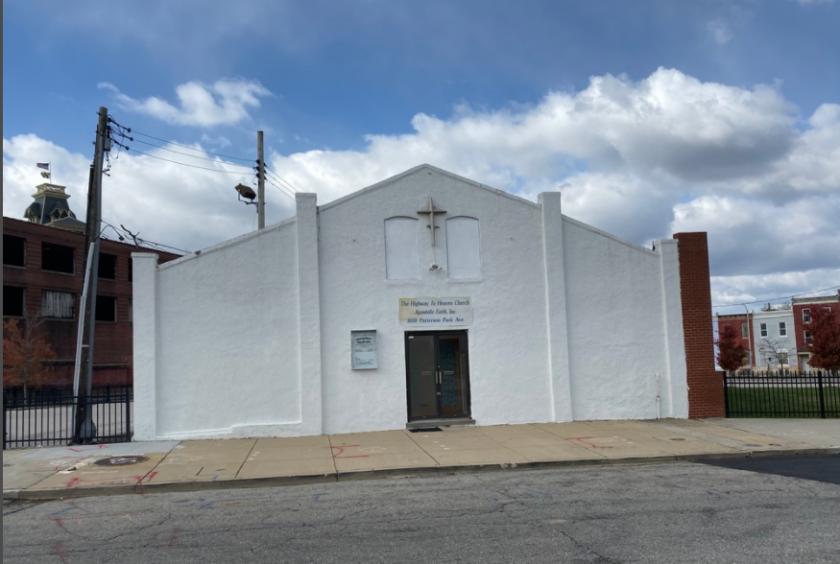
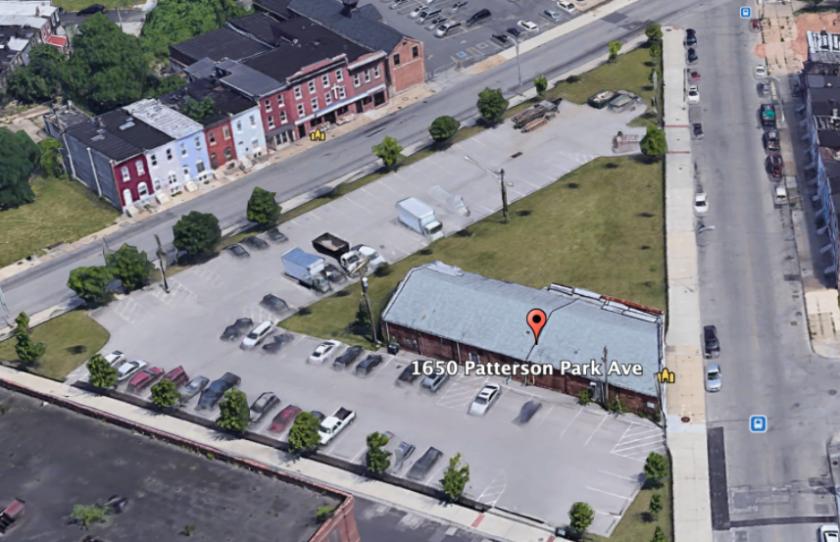
1650 North Patterson Park Avenue Baltimore, MD 21213
1650 North Patterson Park Avenue Baltimore, MD 21213
Details & Description
Property Highlights
- • Large established church w capacity for 300 people
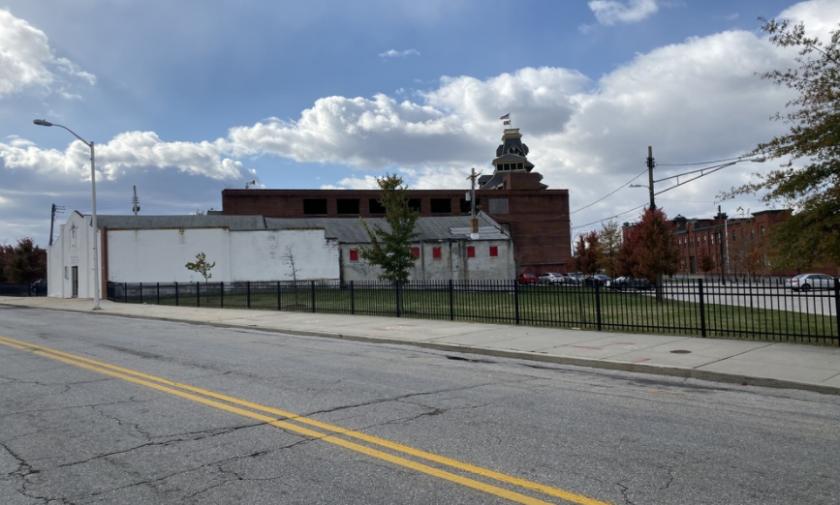
- • Large fully fenced city owned corner lot.
- • Main building is 8384 Sf
Listing Agents

Nicholas Piscatelli
O: 410-365-0200
M: 410-365-0200
npiscatelli@gmail.com
O: 410-365-0200
M: 410-365-0200
npiscatelli@gmail.com
While we strive to provide the most accurate information, all listing information, and demographic data, is provided by third-parties. As such, MyEListing will not be responsible for the accuracy of the information. It is strongly recommended that you verify all information with the listing agent, and any relevant agencies, prior to making any decisions.