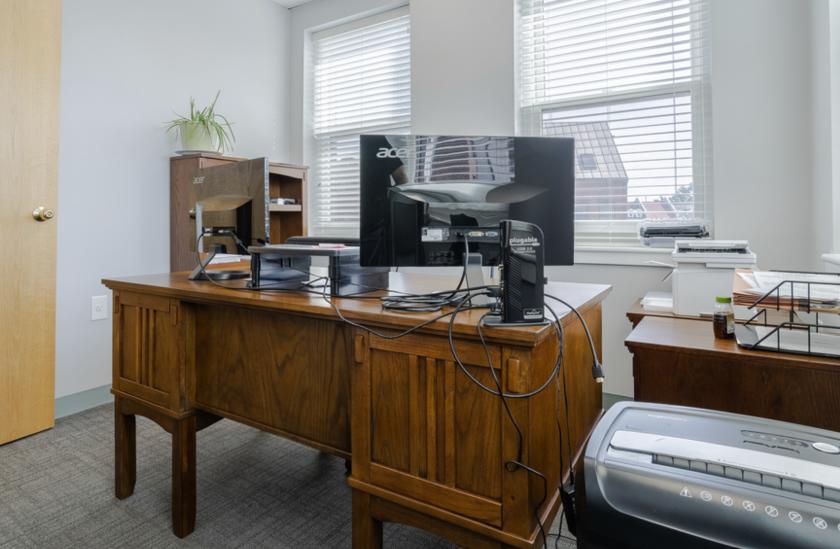
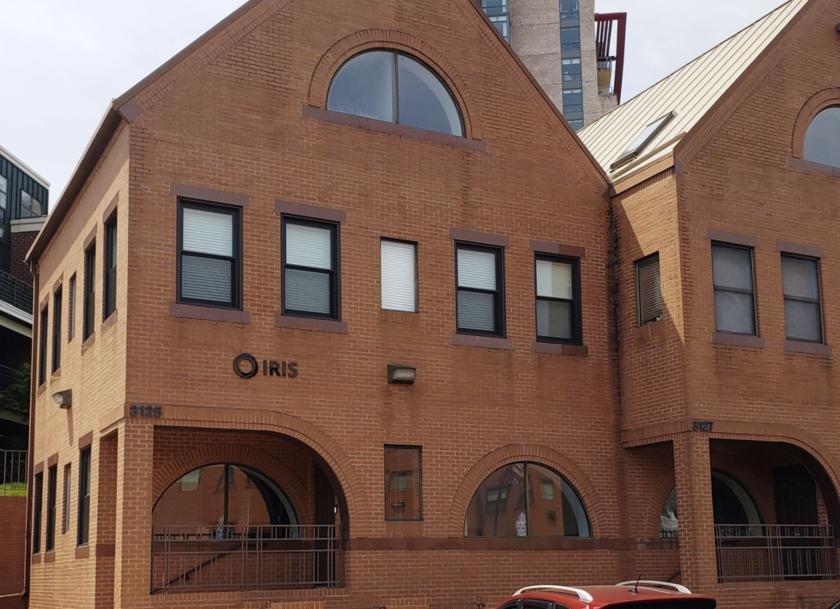
1-Mile | 3-Miles | 5-Miles | ||
---|---|---|---|---|
Total Population | 32,113 | 211,800 | 612,896 | |
Population Median Age | 36 | 37 | 36 | |
Population by Age | 0-9 Yrs | 4926 (15%) | 25885 (12%) | 73444 (11%) |
10-19 Yrs | 2243 (6%) | 15266 (7%) | 55039 (8%) | |
20-29 Yrs | 4617 (14%) | 35754 (16%) | 116060 (18%) | |
30-39 Yrs | 7387 (23%) | 48818 (23%) | 125091 (20%) | |
40-49 Yrs | 5005 (15%) | 29741 (14%) | 79857 (13%) | |
50-59 Yrs | 3918 (12%) | 24150 (11%) | 68173 (11%) | |
60-69 Yrs | 2387 (7%) | 18143 (8%) | 53024 (8%) | |
70+ Yrs | 1629 (5%) | 14043 (6%) | 42209 (6%) | |
Median HH Income | $121,851 | $107,119 | $94,302 | |
Total Household Income | < 24K | 991 (7%) | 9274 (9%) | 35569 (13%) |
25-49K | 1257 (9%) | 10600 (10%) | 34057 (12%) | |
50-74K | 1540 (11%) | 12902 (13%) | 36883 (13%) | |
75-99K | 1656 (12%) | 12653 (12%) | 34461 (12%) | |
100-199K | 4488 (33%) | 33581 (34%) | 81626 (30%) | |
200K+ | 3611 (26%) | 18364 (18%) | 43639 (16%) | |
Highest Education Level | No Diploma | 2374 | 9586 | 36972 |
Diploma or GED | 2045 | 16797 | 62755 | |
Some College | 2010 | 16842 | 55631 | |
Assoc. Degree | 768 | 7179 | 20380 | |
Bachelors Degree | 7758 | 50455 | 125078 | |
Higher Degree | 8695 | 58149 | 137648 | |
Total Housing Units | 14,258 | 105,913 | 291,158 | |
--Owner-Occupied | 6,846 | 38,722 | 103,889 | |
--Renter-Occupied | 6,696 | 58,653 | 162,347 | |
Owner-Occupied Values | < 100K | 67 | 600 | 1699 |
100-199K | 67 | 1112 | 6581 | |
200-299K | 427 | 3655 | 13859 | |
300-399K | 450 | 5785 | 16123 | |
400-499K | 549 | 5228 | 14299 | |
500K+ | 5287 | 22341 | 51328 | |
Total Working Age Population | 25,709 | 176,474 | 507,628 | |
In Work Force | 21,007 | 139,429 | 381,499 | |
Not In Work Force | 4,701 | 37,045 | 126,129 | |
Workforce Employed | 19,901 | 129,008 | 353,274 | |
Workforce Unemployed | 423 | 4,281 | 17,620 | |
Civlian Workforce | 20,324 | 133,289 | 370,893 | |
Military Workforce | 683 | 6,140 | 10,606 | |
Total Households | 13,543 | 97,375 | 266,235 | |
Family Households | 7,210 | 45,189 | 124,904 | |
Non-Family Households | 6,333 | 52,186 | 141,332 | |
Married Couple | 5,937 | 35,529 | 86,749 | |
Other Family | 1,273 | 9,659 | 38,155 | |
Married w/Child | 2,619 | 14,904 | 35,925 | |
Single Male w/Child | 172 | 920 | 3,539 | |
Single Female w/Child | 502 | 3,740 | 15,338 |
Population Change Last Two Decades - Plus Projection
2000 | % | 2010 | % | 2020 | % | 2030 | |
---|---|---|---|---|---|---|---|
District of Columbia | 572,059 | +5 | 601,723 | +21 | 729,501 | +15 | 842,154 |
Maryland | 5,296,486 | +9 | 5,773,552 | +6 | 6,141,900 | +6 | 6,518,750 |
Prince Georges County | 801,515 | +8 | 863,420 | +6 | 916,150 | +4 | 952,950 |
Virginia | 7,078,515 | +13 | 8,001,024 | +8 | 8,655,021 | +8 | 9,331,666 |
Arlington County | 189,453 | +10 | 207,627 | +20 | 249,298 | +10 | 274,339 |
Fairfax County | 969,749 | +12 | 1,081,726 | +7 | 1,162,504 | +7 | 1,244,025 |
Alexandria city | 128,283 | +9 | 139,966 | +19 | 166,261 | +10 | 182,067 |
Total Working Age Population:
Total Households:
Total Working Age Population:
Total Households:
Total Working Age Population:
Total Households: