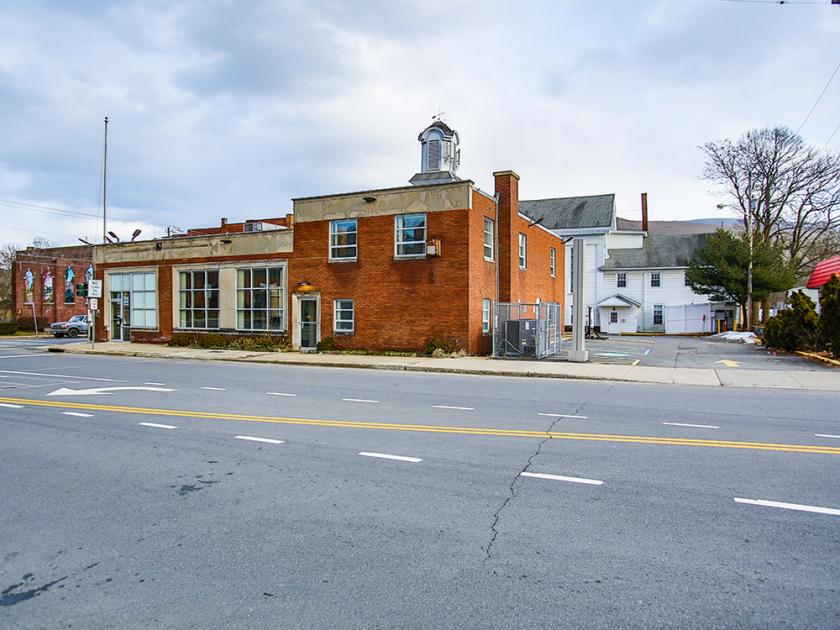
1-Mile | 3-Miles | 5-Miles | ||
---|---|---|---|---|
Total Population | 3,058 | 6,952 | 10,319 | |
Population Median Age | 37 | 40 | 41 | |
Population by Age | 0-9 Yrs | 403 (13%) | 674 (9%) | 928 (8%) |
10-19 Yrs | 534 (17%) | 1044 (15%) | 1331 (12%) | |
20-29 Yrs | 370 (12%) | 844 (12%) | 1252 (12%) | |
30-39 Yrs | 345 (11%) | 843 (12%) | 1451 (14%) | |
40-49 Yrs | 393 (12%) | 956 (13%) | 1435 (13%) | |
50-59 Yrs | 416 (13%) | 1040 (14%) | 1611 (15%) | |
60-69 Yrs | 256 (8%) | 684 (9%) | 1089 (10%) | |
70+ Yrs | 341 (11%) | 866 (12%) | 1220 (11%) | |
Median HH Income | $42,714 | $45,139 | $49,037 | |
Total Household Income | < 24K | 356 (29%) | 681 (26%) | 875 (24%) |
25-49K | 357 (29%) | 767 (29%) | 960 (26%) | |
50-74K | 199 (16%) | 424 (16%) | 598 (16%) | |
75-99K | 138 (11%) | 260 (10%) | 386 (10%) | |
100-199K | 159 (13%) | 438 (16%) | 686 (19%) | |
200K+ | 0 (0%) | 28 (1%) | 95 (2%) | |
Highest Education Level | No Diploma | 441 | 885 | 1174 |
Diploma or GED | 648 | 1753 | 2799 | |
Some College | 404 | 920 | 1393 | |
Assoc. Degree | 150 | 461 | 786 | |
Bachelors Degree | 138 | 390 | 704 | |
Higher Degree | 170 | 418 | 622 | |
Total Housing Units | 1,451 | 3,300 | 4,787 | |
--Owner-Occupied | 530 | 1,394 | 2,207 | |
--Renter-Occupied | 678 | 1,206 | 1,392 | |
Owner-Occupied Values | < 100K | 221 | 541 | 732 |
100-199K | 241 | 603 | 887 | |
200-299K | 21 | 106 | 318 | |
300-399K | 34 | 69 | 147 | |
400-499K | 0 | 30 | 48 | |
500K+ | 14 | 44 | 75 | |
Total Working Age Population | 2,332 | 5,678 | 8,587 | |
In Work Force | 1,421 | 3,102 | 4,446 | |
Not In Work Force | 911 | 2,576 | 4,141 | |
Workforce Employed | 1,298 | 2,809 | 4,063 | |
Workforce Unemployed | 122 | 293 | 383 | |
Civlian Workforce | 1,421 | 3,102 | 4,446 | |
Military Workforce | 0 | 0 | 0 | |
Total Households | 1,208 | 2,600 | 3,600 | |
Family Households | 725 | 1,534 | 2,179 | |
Non-Family Households | 483 | 1,066 | 1,420 | |
Married Couple | 470 | 1,025 | 1,537 | |
Other Family | 255 | 509 | 642 | |
Married w/Child | 217 | 410 | 593 | |
Single Male w/Child | 34 | 82 | 117 | |
Single Female w/Child | 113 | 183 | 214 |
Population Change Last Two Decades - Plus Projection
2000 | % | 2010 | % | 2020 | % | 2030 | |
---|---|---|---|---|---|---|---|
New York | 18,976,457 | +2 | 19,378,102 | +4 | 20,146,131 | +2 | 20,604,030 |
Sullivan County | 73,966 | +5 | 77,547 | -3 | 74,968 | 0 | 74,720 |
Ulster County | 177,749 | +3 | 182,493 | -2 | 179,009 | -1 | 176,893 |
Total Working Age Population:
Total Households:
Total Working Age Population:
Total Households:
Total Working Age Population:
Total Households: