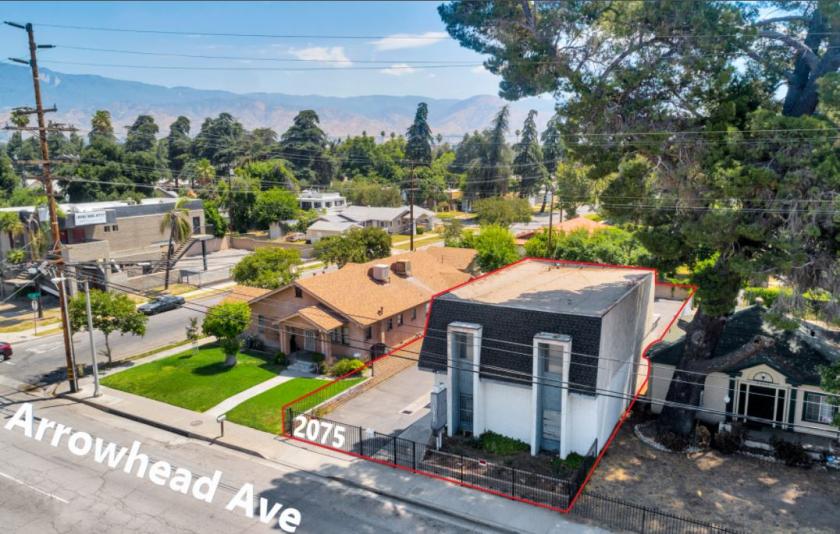
Office Space
2075 North Arrowhead Avenue San Bernardino, CA 92405
2075 North Arrowhead Avenue San Bernardino, CA 92405
Details & Description
Property Highlights
• HIGH TRAFFIC COUNT
• MEDICAL ALLEY
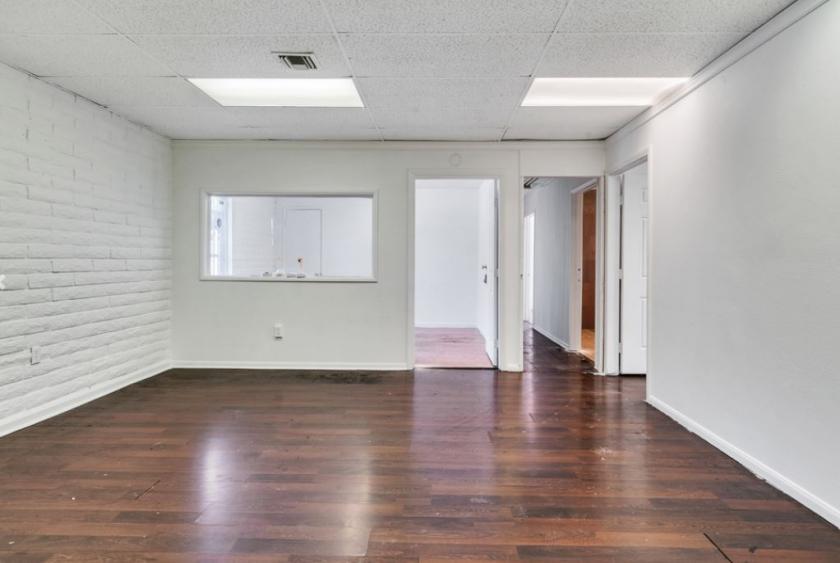
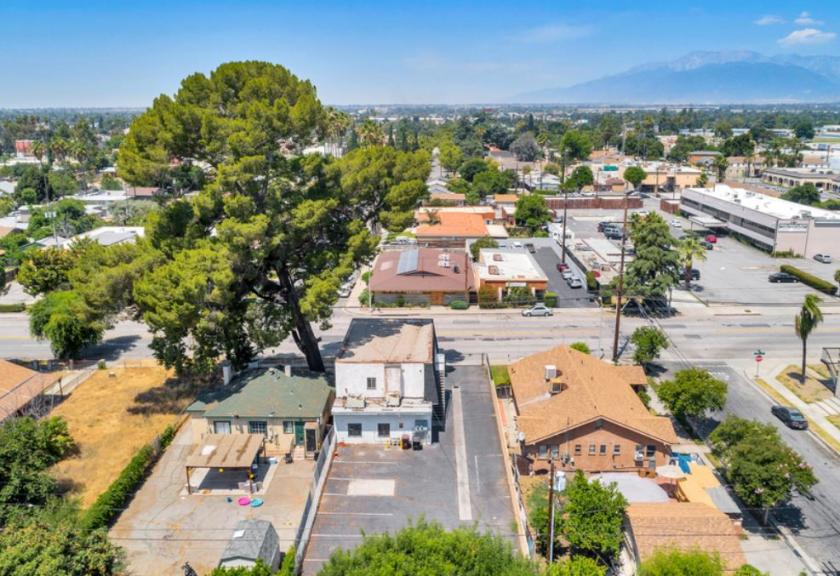
Additional Photos

Listing Agents

T.C. Obichang
KW Commercial
O: 951-703-0377
tc.obi@kw.com
KW Commercial
O: 951-703-0377
tc.obi@kw.com
While we strive to provide the most accurate information, all listing information, and demographic data, is provided by third-parties. As such, MyEListing will not be responsible for the accuracy of the information. It is strongly recommended that you verify all information with the listing agent, and any relevant agencies, prior to making any decisions.


