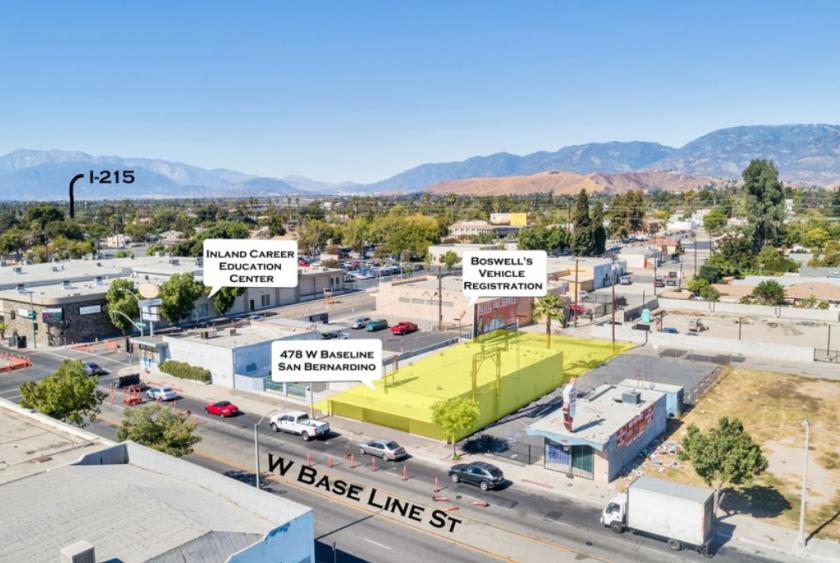
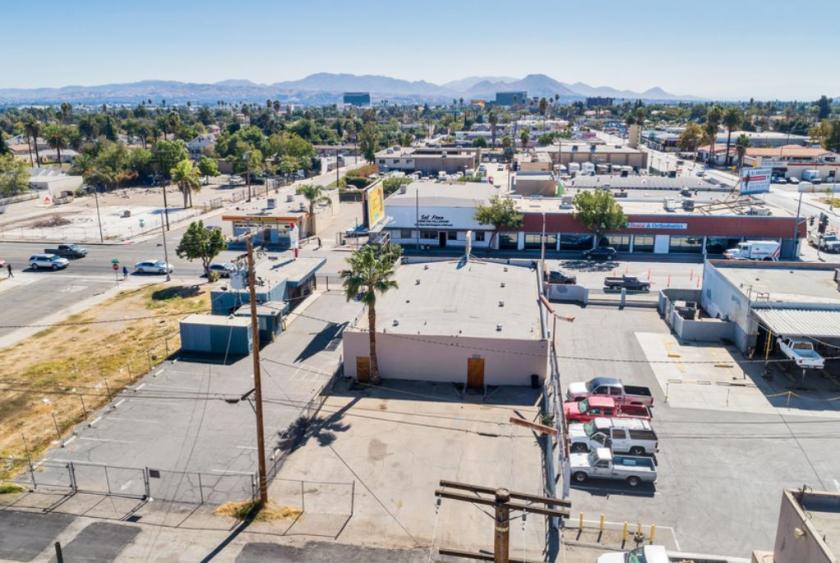
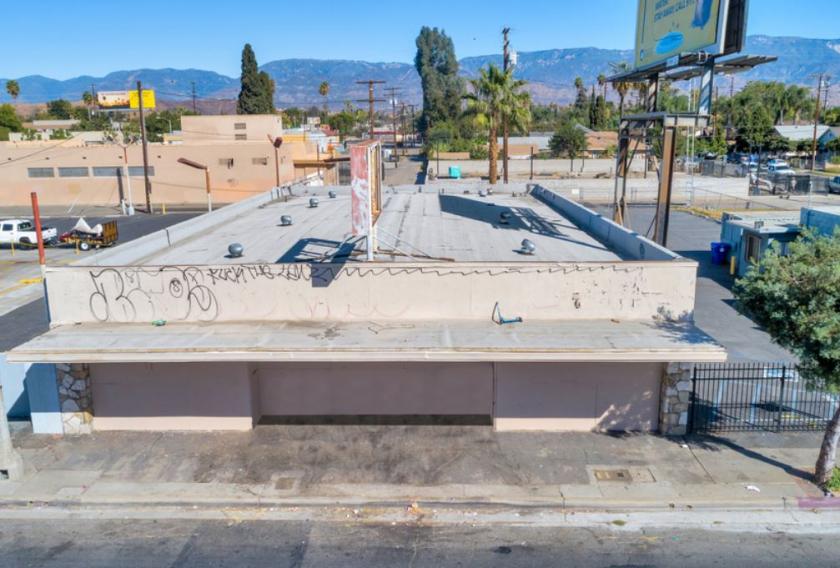
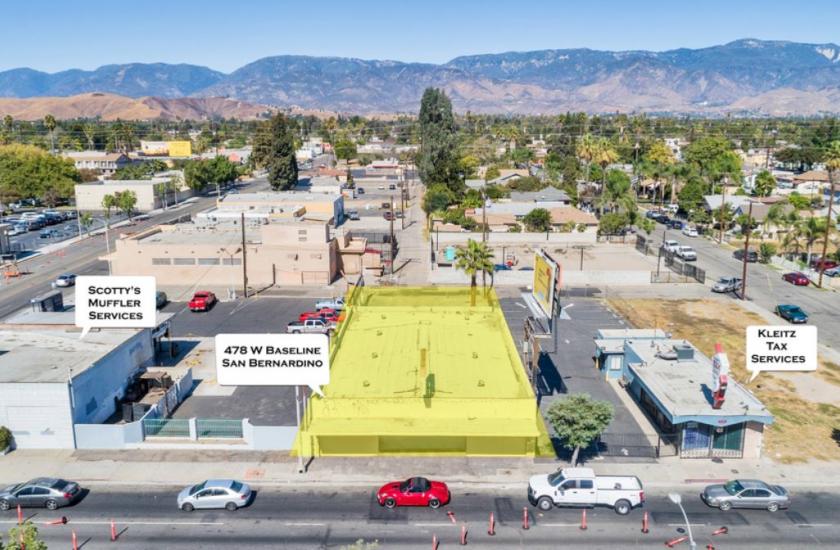
1-Mile | 3-Miles | 5-Miles | ||
---|---|---|---|---|
Total Population | 27,732 | 151,861 | 363,436 | |
Population Median Age | 31 | 32 | 32 | |
Population by Age | 0-9 Yrs | 5260 (18%) | 27472 (18%) | 60870 (16%) |
10-19 Yrs | 4864 (17%) | 26290 (17%) | 58968 (16%) | |
20-29 Yrs | 4391 (15%) | 24964 (16%) | 63989 (17%) | |
30-39 Yrs | 4009 (14%) | 20559 (13%) | 51370 (14%) | |
40-49 Yrs | 3033 (10%) | 17362 (11%) | 41957 (11%) | |
50-59 Yrs | 2760 (9%) | 16486 (10%) | 39273 (10%) | |
60-69 Yrs | 1847 (6%) | 9914 (6%) | 26739 (7%) | |
70+ Yrs | 1567 (5%) | 8813 (5%) | 20270 (5%) | |
Median HH Income | $32,573 | $40,374 | $47,069 | |
Total Household Income | < 24K | 3087 (38%) | 13224 (31%) | 25302 (25%) |
25-49K | 2782 (34%) | 11832 (28%) | 26884 (27%) | |
50-74K | 1122 (14%) | 7474 (17%) | 18747 (19%) | |
75-99K | 557 (6%) | 4374 (10%) | 12248 (12%) | |
100-199K | 367 (4%) | 4288 (10%) | 13857 (14%) | |
200K+ | 52 (0%) | 450 (1%) | 1567 (1%) | |
Highest Education Level | No Diploma | 6615 | 30892 | 66349 |
Diploma or GED | 4539 | 25955 | 63149 | |
Some College | 2507 | 17695 | 45183 | |
Assoc. Degree | 737 | 4515 | 13278 | |
Bachelors Degree | 523 | 5081 | 16717 | |
Higher Degree | 214 | 1993 | 6374 | |
Total Housing Units | 8,630 | 44,637 | 105,893 | |
--Owner-Occupied | 1,912 | 17,679 | 47,710 | |
--Renter-Occupied | 6,055 | 23,964 | 50,895 | |
Owner-Occupied Values | < 100K | 88 | 2203 | 5463 |
100-199K | 757 | 4941 | 8928 | |
200-299K | 799 | 7434 | 19404 | |
300-399K | 202 | 2237 | 10796 | |
400-499K | 10 | 576 | 2081 | |
500K+ | 57 | 288 | 1039 | |
Total Working Age Population | 19,256 | 108,077 | 267,200 | |
In Work Force | 10,685 | 63,910 | 159,620 | |
Not In Work Force | 8,571 | 44,167 | 107,579 | |
Workforce Employed | 9,599 | 57,455 | 144,070 | |
Workforce Unemployed | 1,086 | 6,421 | 15,476 | |
Civlian Workforce | 10,685 | 63,876 | 159,546 | |
Military Workforce | 0 | 34 | 74 | |
Total Households | 7,967 | 41,643 | 98,605 | |
Family Households | 5,711 | 31,248 | 75,973 | |
Non-Family Households | 2,257 | 10,395 | 22,632 | |
Married Couple | 2,895 | 16,258 | 42,544 | |
Other Family | 2,815 | 14,990 | 33,429 | |
Married w/Child | 1,745 | 8,571 | 21,275 | |
Single Male w/Child | 384 | 1,844 | 4,673 | |
Single Female w/Child | 1,161 | 6,398 | 13,365 |
Population Change Last Two Decades - Plus Projection
2000 | % | 2010 | % | 2020 | % | 2030 | |
---|---|---|---|---|---|---|---|
California | 33,871,648 | +10 | 37,253,956 | +9 | 40,467,295 | +8 | 43,631,295 |
Riverside County | 1,545,387 | +42 | 2,189,641 | +14 | 2,493,116 | +14 | 2,843,493 |
San Bernardino County | 1,709,434 | +19 | 2,035,210 | +9 | 2,223,189 | +11 | 2,468,202 |
Total Working Age Population:
Total Households:
Total Working Age Population:
Total Households:
Total Working Age Population:
Total Households: