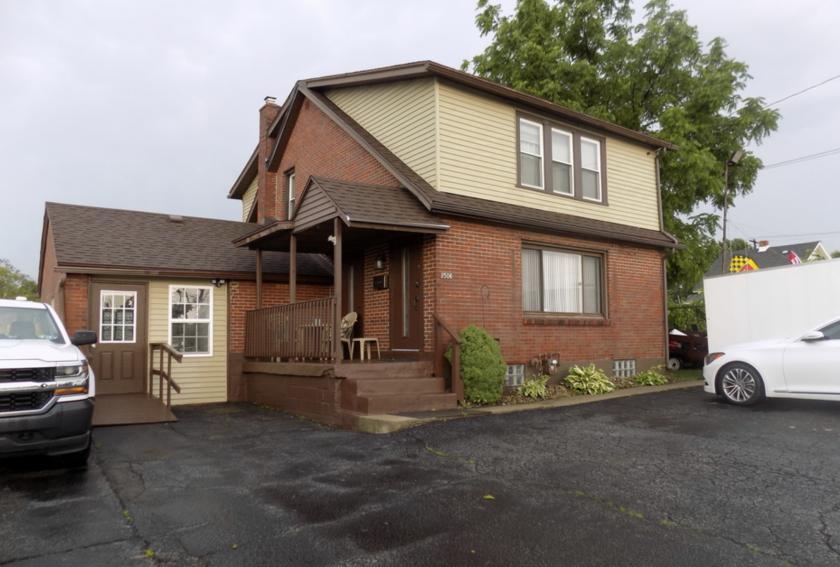
Office Space
2506 Freeport Road Natrona Heights, PA 15065
2506 Freeport Road Natrona Heights, PA 15065
Details & Description
Property Highlights
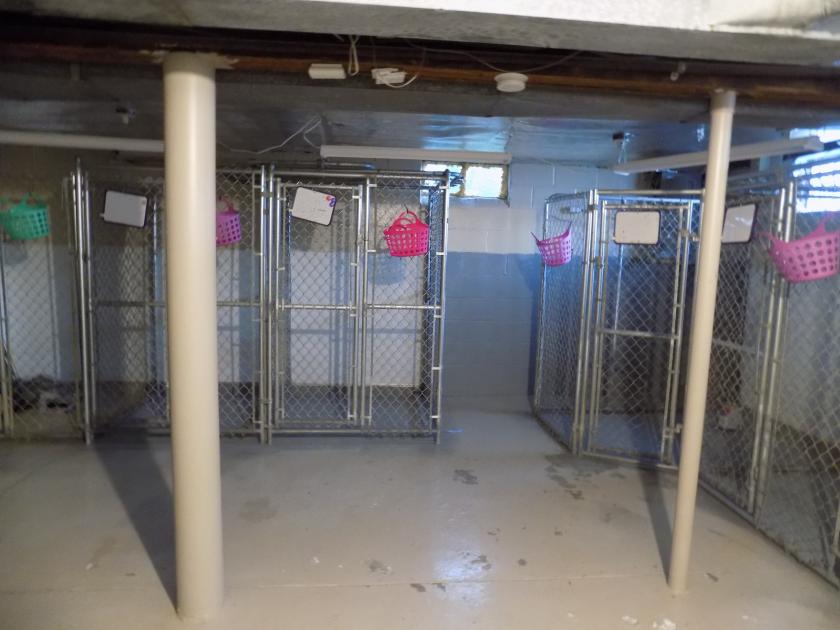
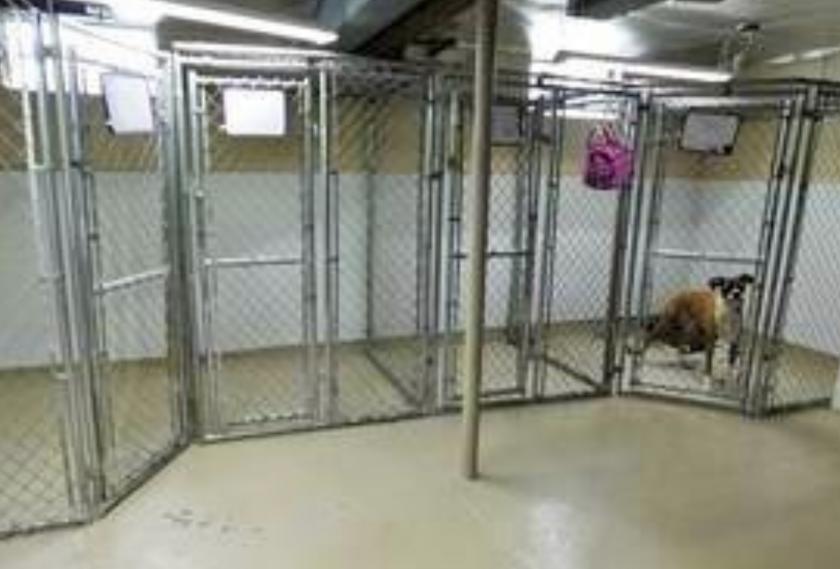
- • Lower level kennel houses 22x20 - houses 8 dogs
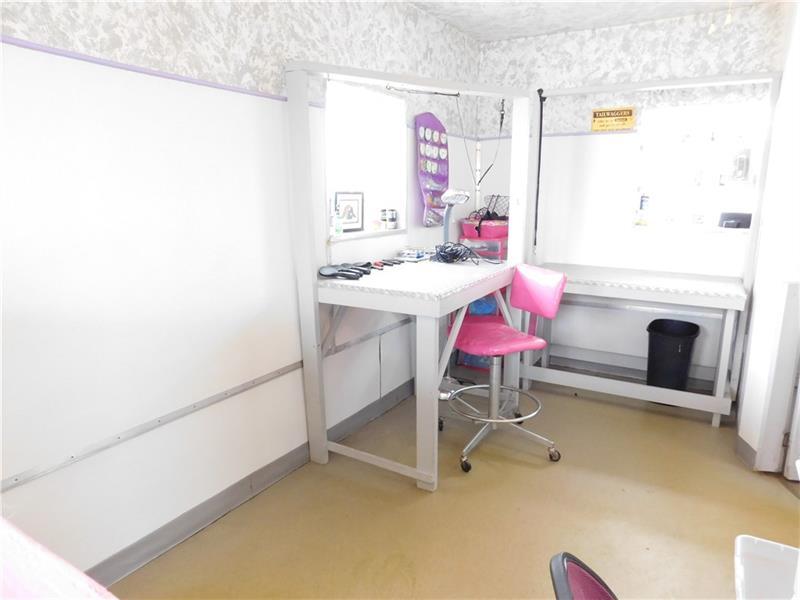
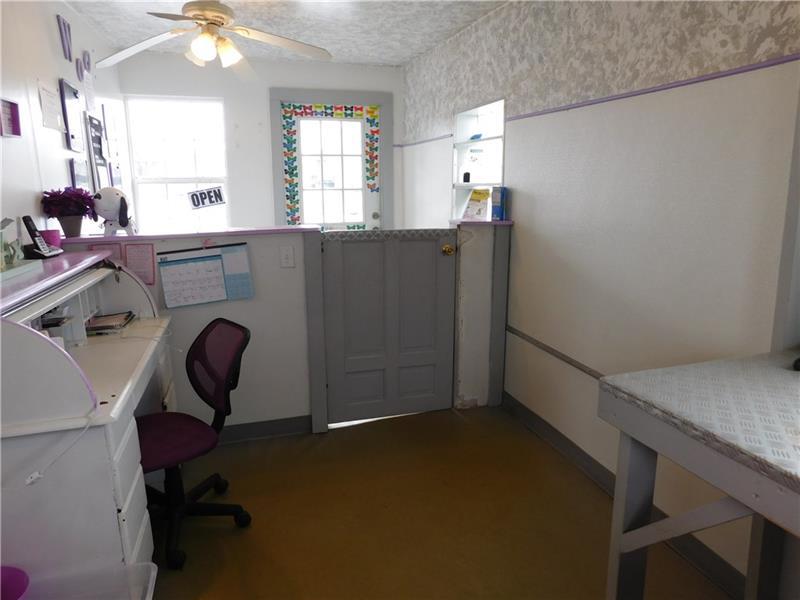
- • Main level - grooming salon 19x16
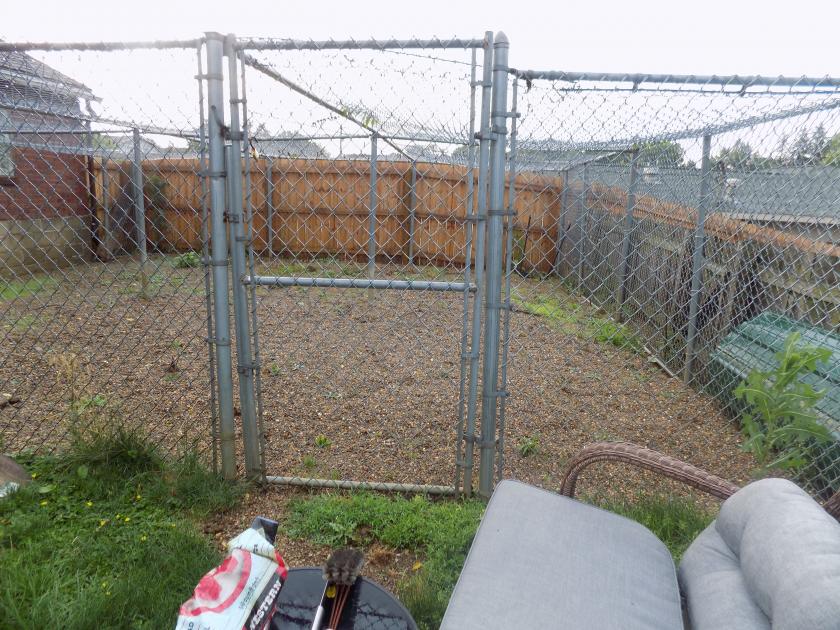
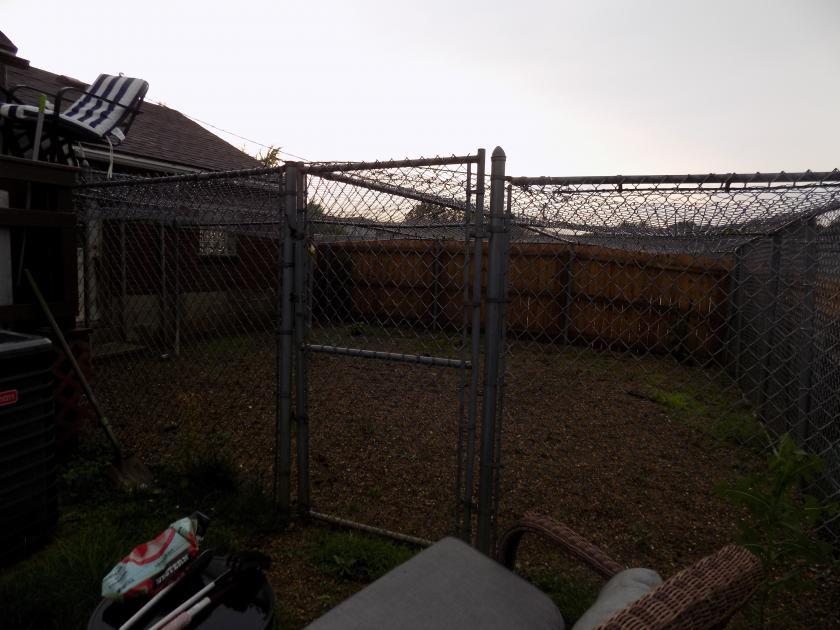
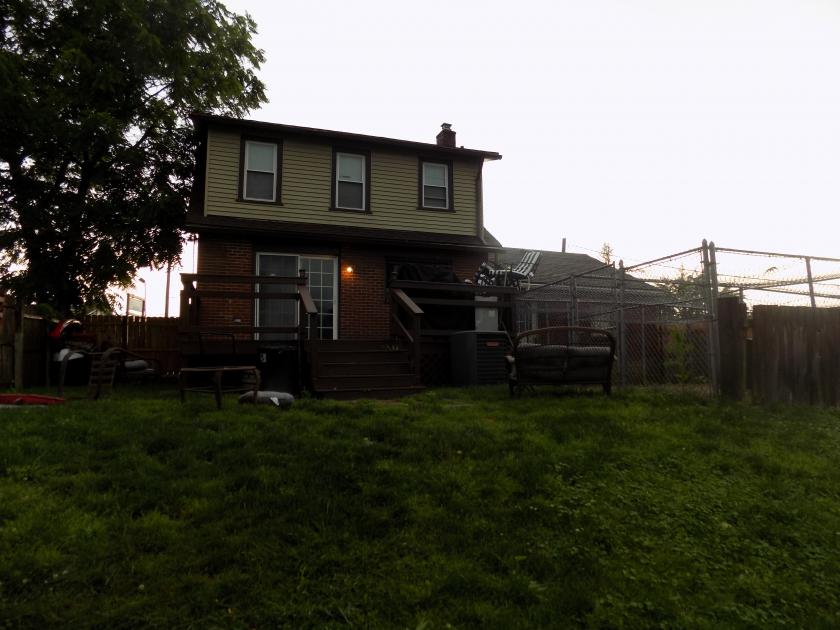
- • Outdoor dog runs 32x27
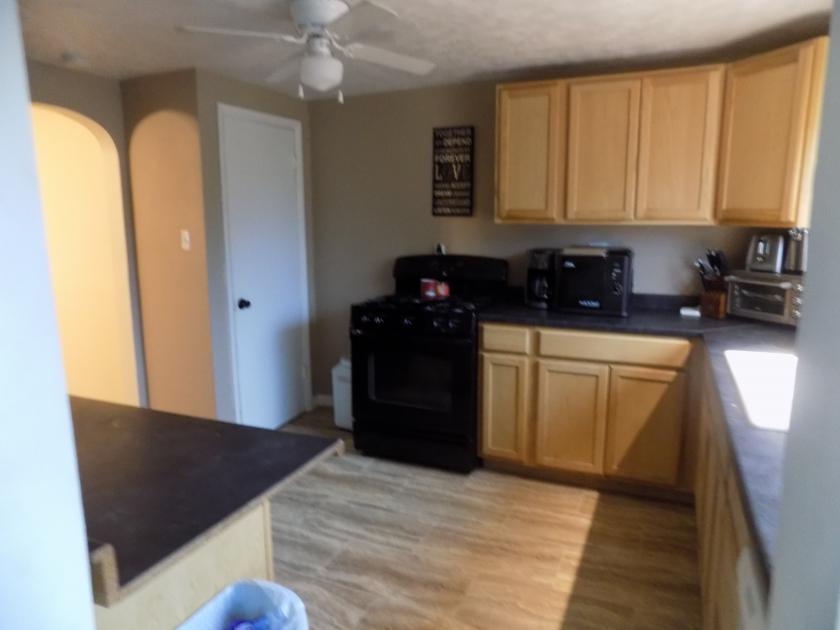
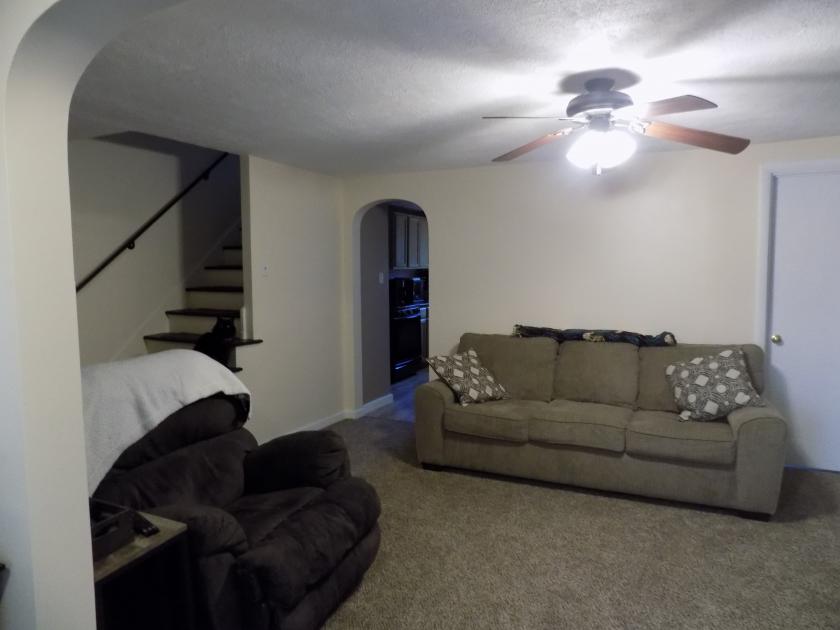
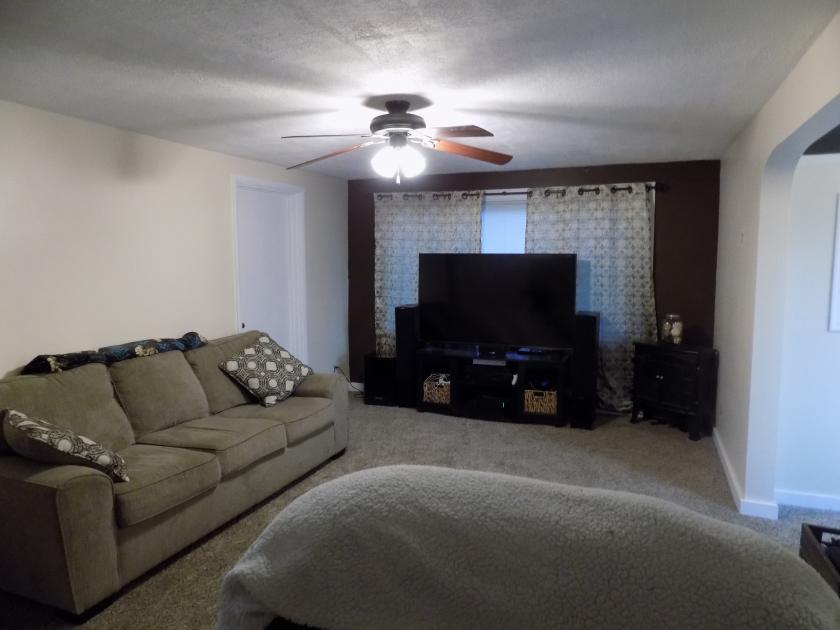
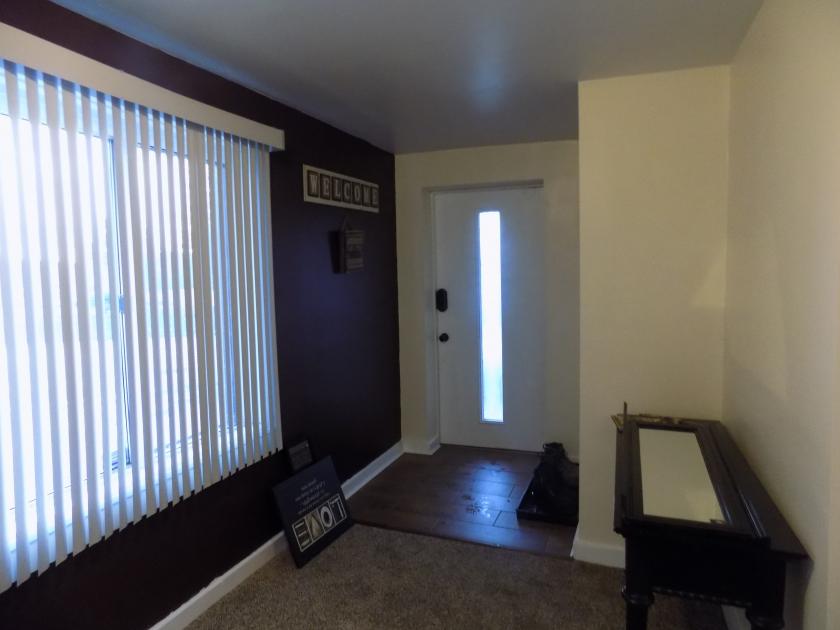
- • Separate entrances for business and residence
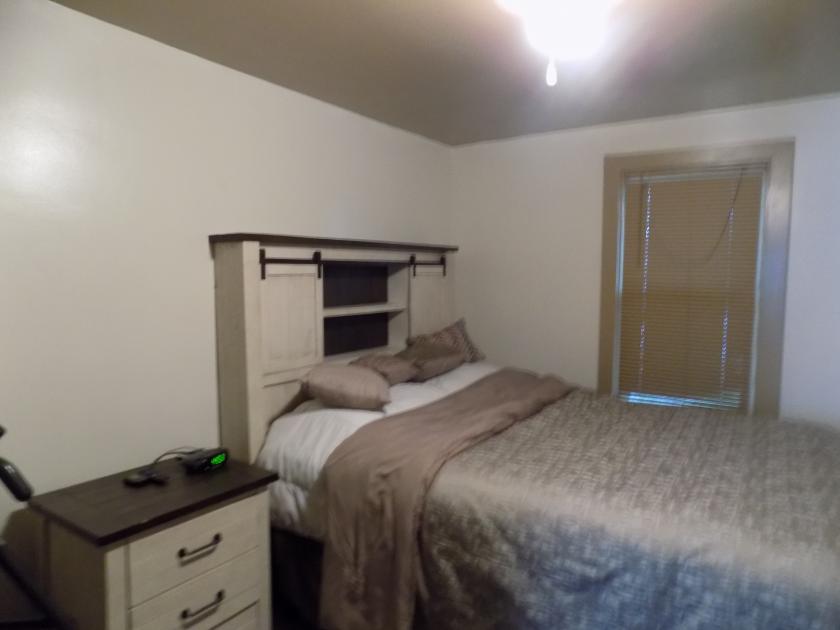
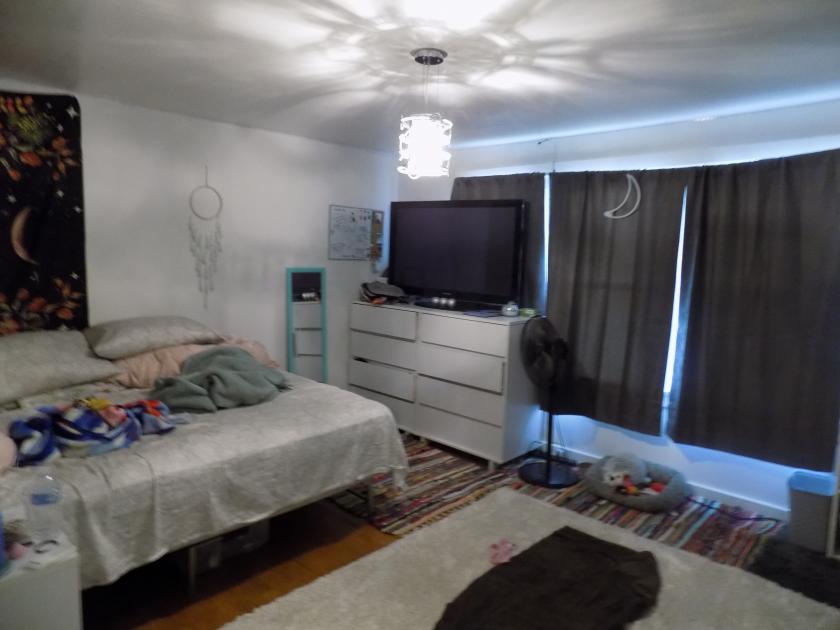
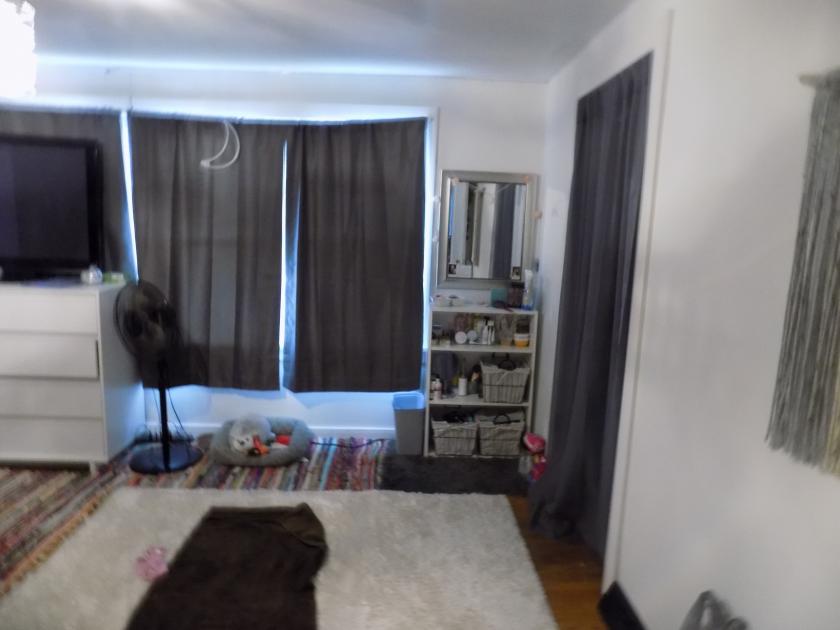
Additional Photos
Listing Agents

Daniel Romanelli
KW Commercial
O: 724-933-8592
M: 412-498-4889
dromanelli@kw.com
KW Commercial
O: 724-933-8592
M: 412-498-4889
dromanelli@kw.com
While we strive to provide the most accurate information, all listing information, and demographic data, is provided by third-parties. As such, MyEListing will not be responsible for the accuracy of the information. It is strongly recommended that you verify all information with the listing agent, and any relevant agencies, prior to making any decisions.