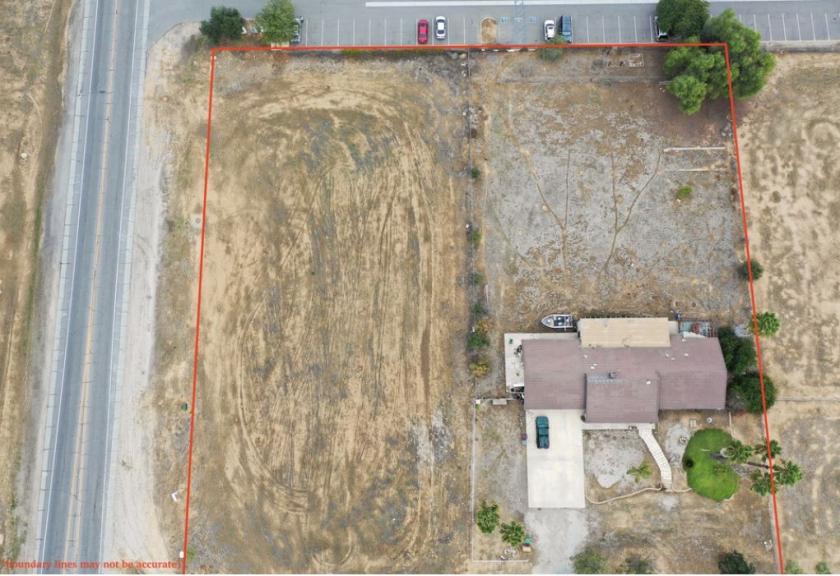
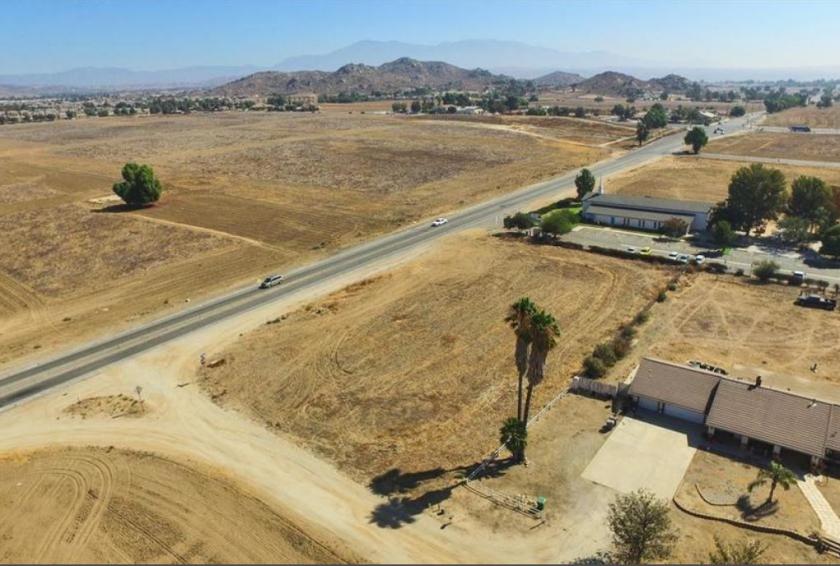
Commercial Land
14050 Blue Ribbon Lane Moreno Valley, CA 92555
14050 Blue Ribbon Lane Moreno Valley, CA 92555
Details & Description
Property Highlights
- • COMMERCIAL ZONED OFFICE MEDICAL.
- • ALLOWED USES SENIOR HOUSING.
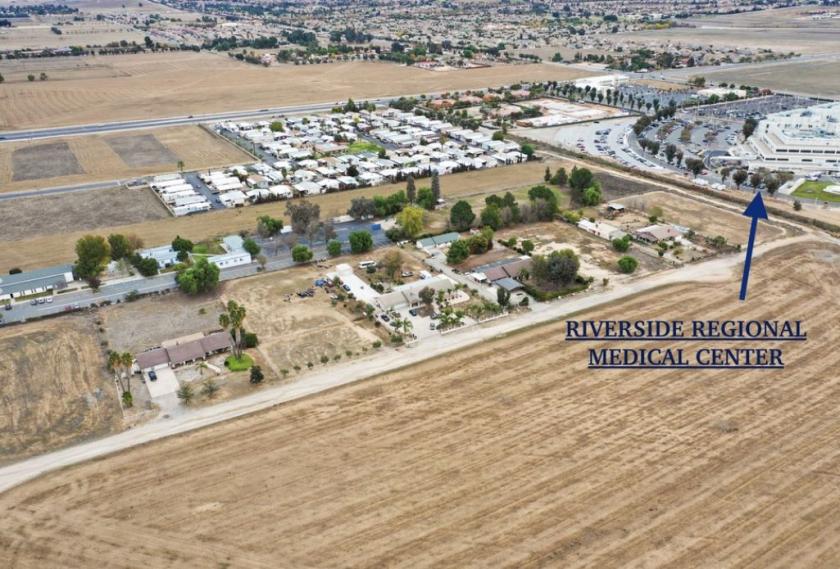
- • ACROSS FROM RIVERSIDE REGIONAL MEDICAL CENTER.
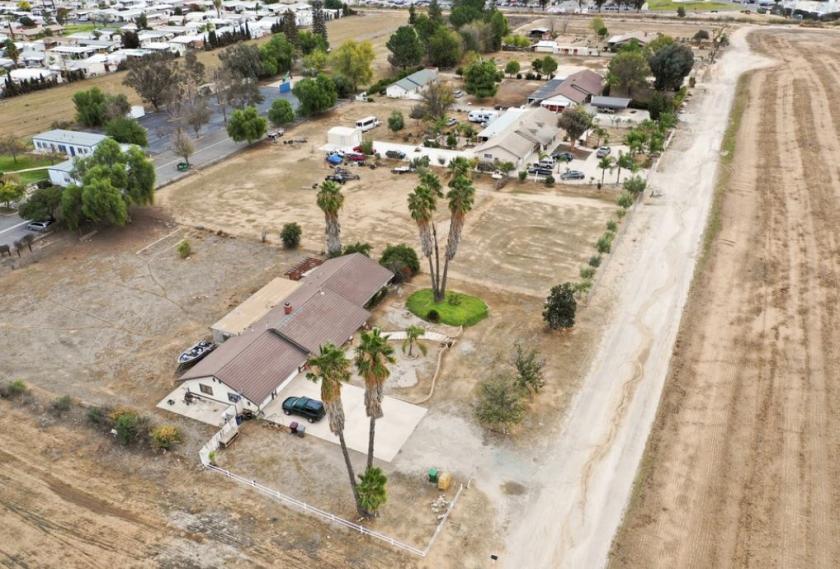
- • CURRENT RENTAL PROPERTY WITH TENANT.
- • PRIME FOR DEVELOPMENT
Additional Photos
Listing Agents

T.C. Obichang
KW Commercial
O: 951-703-0377
tc.obi@kw.com
KW Commercial
O: 951-703-0377
tc.obi@kw.com
While we strive to provide the most accurate information, all listing information, and demographic data, is provided by third-parties. As such, MyEListing will not be responsible for the accuracy of the information. It is strongly recommended that you verify all information with the listing agent, and any relevant agencies, prior to making any decisions.


