Specialty Real Estate
8000 East Port Drive Little Rock, AR 72206
8000 East Port Drive Little Rock, AR 72206

Details & Description
Property Highlights
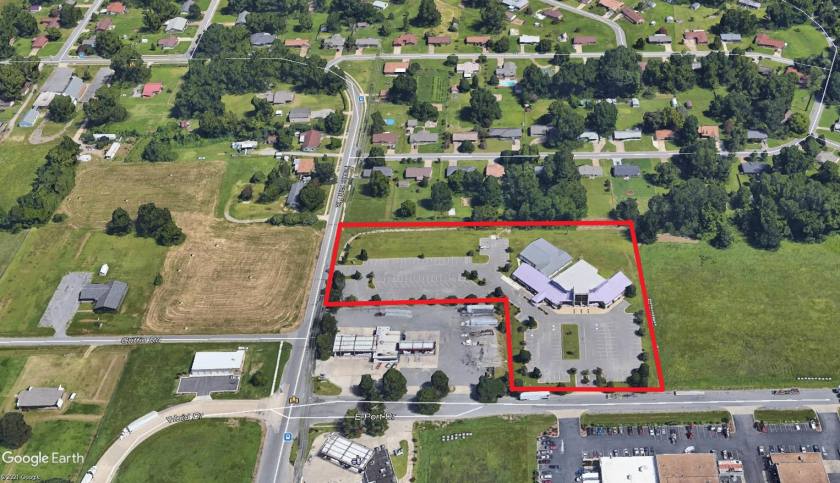
• Close to airport and convenient to the Little Rock River Port industrial park and all of the Little Rock Metro area.
• Sanctuary seats 400, there are multiple classrooms, a commercial kitchen, fellowship hall, offices, classrooms, more
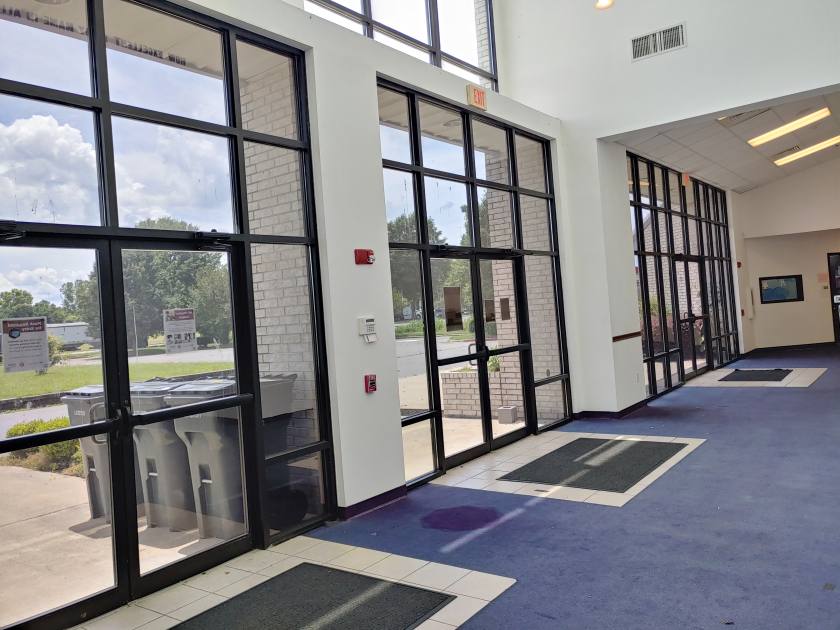
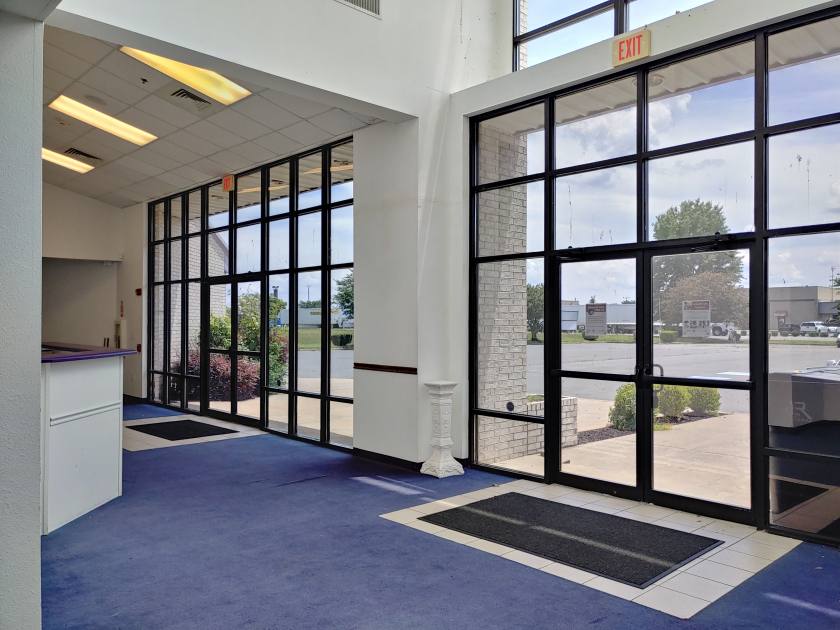
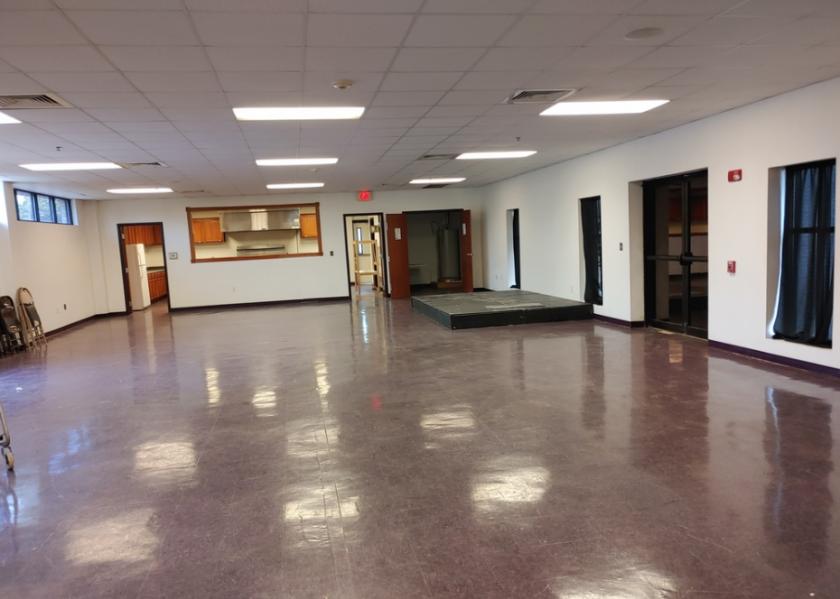
Additional Photos


Listing Agents

Johnny Mitchum
O: 501-940-3231
M: 501-940-3231
jmitchum@kw.com
O: 501-940-3231
M: 501-940-3231
jmitchum@kw.com
While we strive to provide the most accurate information, all listing information, and demographic data, is provided by third-parties. As such, MyEListing will not be responsible for the accuracy of the information. It is strongly recommended that you verify all information with the listing agent, and any relevant agencies, prior to making any decisions.