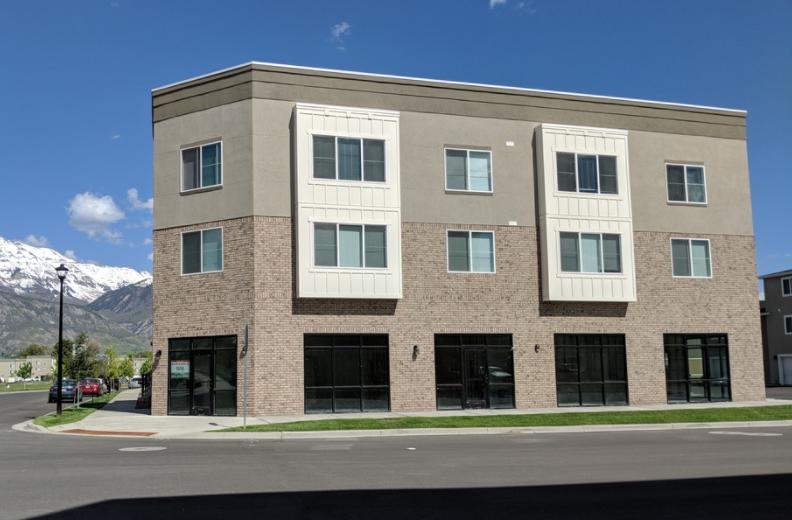
1-Mile | 3-Miles | 5-Miles | ||
---|---|---|---|---|
Total Population | 11,074 | 65,560 | 145,286 | |
Population Median Age | 31 | 31 | 31 | |
Population by Age | 0-9 Yrs | 2214 (19%) | 12412 (18%) | 27548 (18%) |
10-19 Yrs | 1338 (12%) | 12179 (18%) | 29290 (20%) | |
20-29 Yrs | 2610 (23%) | 10827 (16%) | 21774 (14%) | |
30-39 Yrs | 1843 (16%) | 9023 (13%) | 18785 (12%) | |
40-49 Yrs | 924 (8%) | 7316 (11%) | 17259 (11%) | |
50-59 Yrs | 715 (6%) | 5266 (8%) | 12373 (8%) | |
60-69 Yrs | 691 (6%) | 4637 (7%) | 10191 (7%) | |
70+ Yrs | 738 (6%) | 3899 (5%) | 8066 (5%) | |
Median HH Income | $62,525 | $73,722 | $84,089 | |
Total Household Income | < 24K | 481 (11%) | 1759 (9%) | 3518 (8%) |
25-49K | 1037 (25%) | 4242 (21%) | 6863 (16%) | |
50-74K | 1027 (25%) | 3960 (20%) | 7464 (18%) | |
75-99K | 530 (13%) | 3008 (15%) | 6699 (16%) | |
100-199K | 891 (21%) | 5385 (27%) | 12717 (31%) | |
200K+ | 88 (2%) | 1171 (5%) | 3301 (8%) | |
Highest Education Level | No Diploma | 285 | 1939 | 3313 |
Diploma or GED | 970 | 5670 | 11393 | |
Some College | 1875 | 9845 | 20937 | |
Assoc. Degree | 694 | 3922 | 8293 | |
Bachelors Degree | 1790 | 9589 | 22203 | |
Higher Degree | 832 | 4184 | 10510 | |
Total Housing Units | 4,338 | 20,239 | 42,237 | |
--Owner-Occupied | 2,076 | 13,485 | 30,444 | |
--Renter-Occupied | 1,978 | 6,039 | 10,118 | |
Owner-Occupied Values | < 100K | 104 | 491 | 854 |
100-199K | 623 | 2174 | 3397 | |
200-299K | 872 | 4368 | 8891 | |
300-399K | 386 | 3598 | 7869 | |
400-499K | 57 | 1515 | 4350 | |
500K+ | 34 | 1339 | 5083 | |
Total Working Age Population | 8,076 | 46,070 | 100,142 | |
In Work Force | 5,674 | 31,546 | 68,086 | |
Not In Work Force | 2,401 | 14,524 | 32,056 | |
Workforce Employed | 5,403 | 30,202 | 65,384 | |
Workforce Unemployed | 266 | 1,281 | 2,560 | |
Civlian Workforce | 5,670 | 31,483 | 67,944 | |
Military Workforce | 5 | 63 | 141 | |
Total Households | 4,054 | 19,524 | 40,562 | |
Family Households | 2,773 | 15,416 | 33,523 | |
Non-Family Households | 1,281 | 4,108 | 7,040 | |
Married Couple | 2,099 | 12,974 | 29,225 | |
Other Family | 674 | 2,442 | 4,297 | |
Married w/Child | 1,092 | 7,025 | 16,335 | |
Single Male w/Child | 59 | 307 | 493 | |
Single Female w/Child | 296 | 839 | 1,401 |
Population Change Last Two Decades - Plus Projection
2000 | % | 2010 | % | 2020 | % | 2030 | |
---|---|---|---|---|---|---|---|
Utah | 2,233,169 | +24 | 2,763,885 | +20 | 3,325,425 | +17 | 3,889,310 |
Salt Lake County | 898,387 | +15 | 1,029,655 | +15 | 1,181,471 | +11 | 1,306,414 |
Utah County | 368,536 | +40 | 516,564 | +31 | 679,188 | +27 | 861,852 |
Total Working Age Population:
Total Households:
Total Working Age Population:
Total Households:
Total Working Age Population:
Total Households: