Industrial Properties
53 Clifton Boulevard Clifton, NJ 07011
53 Clifton Boulevard Clifton, NJ 07011
Details & Description
Property Highlights
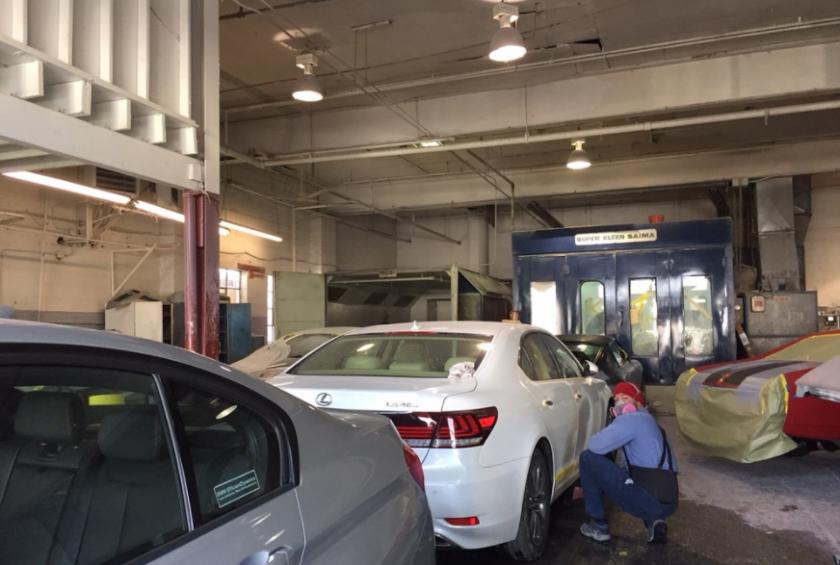
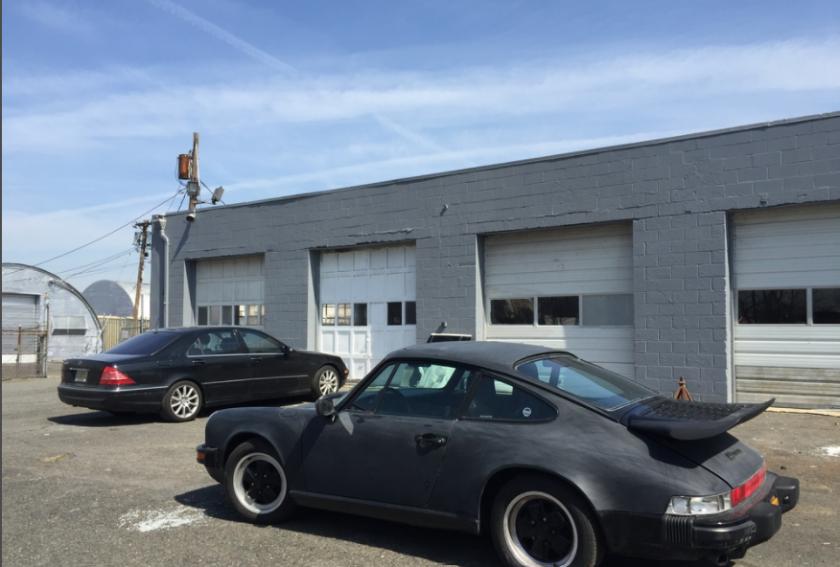
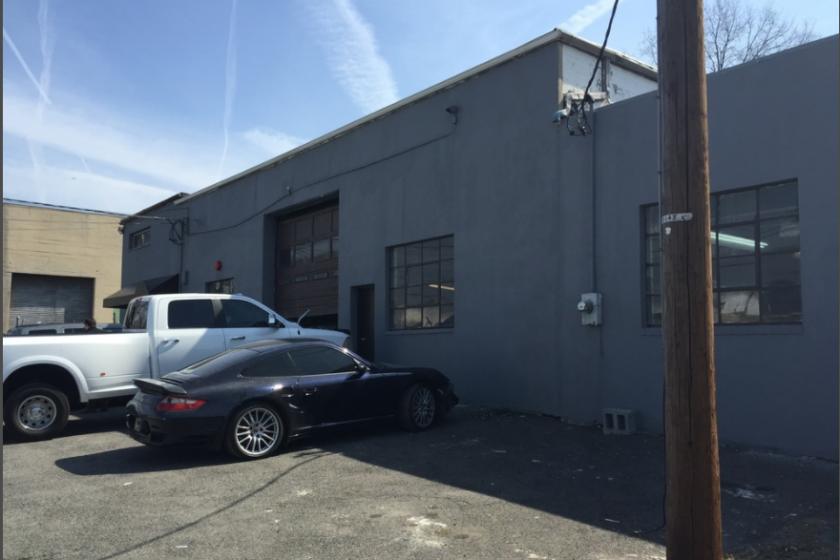
- • 8 baysoverhead doors
- • 2 floors featuring small office space in each
- • Tenant pays utilities
- • Large yard area, some shared with other tenants
- • M-2 Zone
- • Also Available For Sale
Listing Agents

Gina Palumbo
KW Commercial
O: 201-391-2500
M: 201-820-5050
ginapalumbo@kw.com
KW Commercial
O: 201-391-2500
M: 201-820-5050
ginapalumbo@kw.com
While we strive to provide the most accurate information, all listing information, and demographic data, is provided by third-parties. As such, MyEListing will not be responsible for the accuracy of the information. It is strongly recommended that you verify all information with the listing agent, and any relevant agencies, prior to making any decisions.