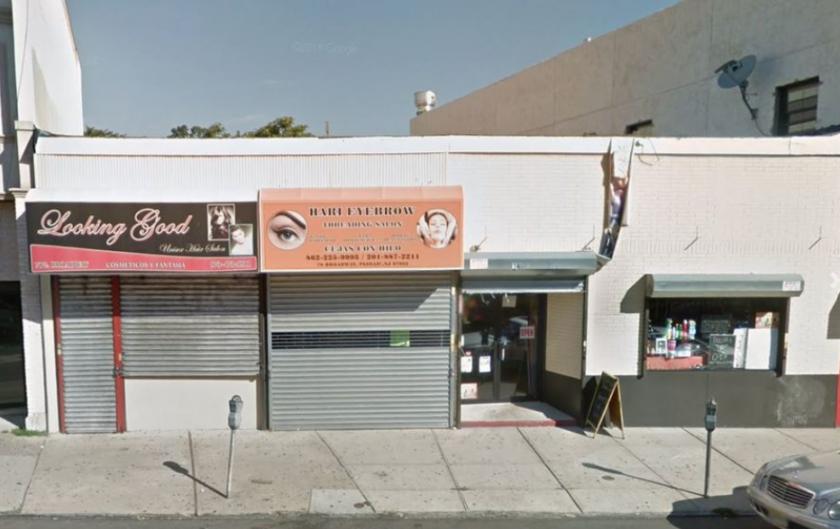
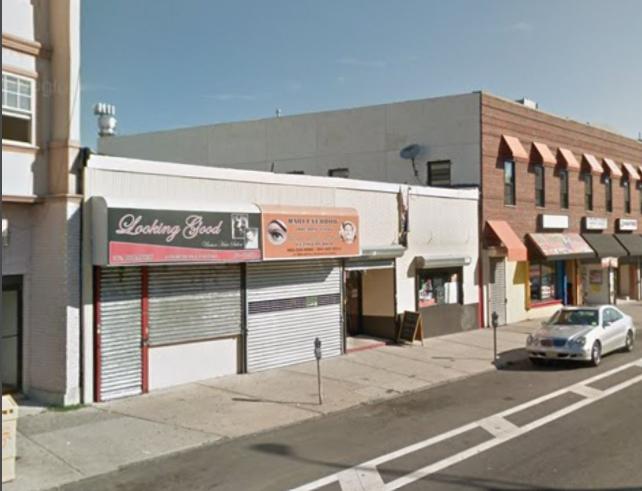
1-Mile | 3-Miles | 5-Miles | ||
---|---|---|---|---|
Total Population | 68,505 | 292,360 | 639,559 | |
Population Median Age | 33 | 38 | 38 | |
Population by Age | 0-9 Yrs | 12041 (17%) | 38122 (13%) | 81489 (12%) |
10-19 Yrs | 10955 (15%) | 37763 (12%) | 79095 (12%) | |
20-29 Yrs | 9798 (14%) | 40007 (13%) | 86594 (13%) | |
30-39 Yrs | 9725 (14%) | 43845 (14%) | 92632 (14%) | |
40-49 Yrs | 9219 (13%) | 38152 (13%) | 84971 (13%) | |
50-59 Yrs | 7167 (10%) | 38476 (13%) | 86398 (13%) | |
60-69 Yrs | 5422 (7%) | 29648 (10%) | 66690 (10%) | |
70+ Yrs | 4178 (6%) | 26347 (9%) | 61692 (9%) | |
Median HH Income | $43,253 | $68,796 | $70,952 | |
Total Household Income | < 24K | 6180 (30%) | 19629 (19%) | 42230 (18%) |
25-49K | 5174 (25%) | 18584 (18%) | 39968 (17%) | |
50-74K | 3284 (16%) | 15320 (15%) | 34664 (15%) | |
75-99K | 2132 (10%) | 12572 (12%) | 28067 (12%) | |
100-199K | 2950 (14%) | 25453 (25%) | 56453 (25%) | |
200K+ | 593 (2%) | 8281 (8%) | 21708 (9%) | |
Highest Education Level | No Diploma | 13017 | 31663 | 63749 |
Diploma or GED | 14318 | 64820 | 140262 | |
Some College | 4915 | 31399 | 69499 | |
Assoc. Degree | 1787 | 11367 | 24374 | |
Bachelors Degree | 4578 | 38783 | 91401 | |
Higher Degree | 1973 | 18911 | 47151 | |
Total Housing Units | 21,813 | 106,395 | 237,374 | |
--Owner-Occupied | 4,821 | 47,288 | 109,493 | |
--Renter-Occupied | 15,493 | 52,552 | 113,597 | |
Owner-Occupied Values | < 100K | 172 | 1155 | 2730 |
100-199K | 765 | 2884 | 7344 | |
200-299K | 1166 | 8807 | 21448 | |
300-399K | 1392 | 16889 | 36162 | |
400-499K | 663 | 9785 | 21648 | |
500K+ | 663 | 7768 | 20162 | |
Total Working Age Population | 50,045 | 231,628 | 511,105 | |
In Work Force | 31,286 | 151,084 | 333,922 | |
Not In Work Force | 18,759 | 80,544 | 177,183 | |
Workforce Employed | 29,645 | 144,520 | 319,549 | |
Workforce Unemployed | 1,615 | 6,428 | 14,181 | |
Civlian Workforce | 31,260 | 150,948 | 333,730 | |
Military Workforce | 27 | 136 | 192 | |
Total Households | 20,314 | 99,840 | 223,090 | |
Family Households | 14,769 | 70,246 | 155,037 | |
Non-Family Households | 5,545 | 29,595 | 68,053 | |
Married Couple | 8,218 | 47,932 | 105,116 | |
Other Family | 6,551 | 22,313 | 49,921 | |
Married w/Child | 4,349 | 21,112 | 45,960 | |
Single Male w/Child | 603 | 2,577 | 5,200 | |
Single Female w/Child | 2,751 | 7,517 | 17,407 |
Population Change Last Two Decades - Plus Projection
2000 | % | 2010 | % | 2020 | % | 2030 | |
---|---|---|---|---|---|---|---|
New Jersey | 8,414,350 | +4 | 8,791,894 | +4 | 9,132,700 | +4 | 9,530,900 |
Bergen County | 884,118 | +2 | 905,116 | +7 | 967,500 | +7 | 1,031,500 |
Essex County | 793,633 | -1 | 783,969 | +3 | 808,300 | +3 | 829,800 |
Hudson County | 608,975 | +4 | 634,266 | +12 | 708,100 | +6 | 747,400 |
Passaic County | 489,049 | +2 | 501,226 | +4 | 521,700 | +3 | 536,100 |
New York | 18,976,457 | +2 | 19,378,102 | +4 | 20,146,131 | +2 | 20,604,030 |
New York County | 1,537,195 | +3 | 1,585,873 | +6 | 1,688,894 | +2 | 1,727,631 |
Total Working Age Population:
Total Households:
Total Working Age Population:
Total Households:
Total Working Age Population:
Total Households: