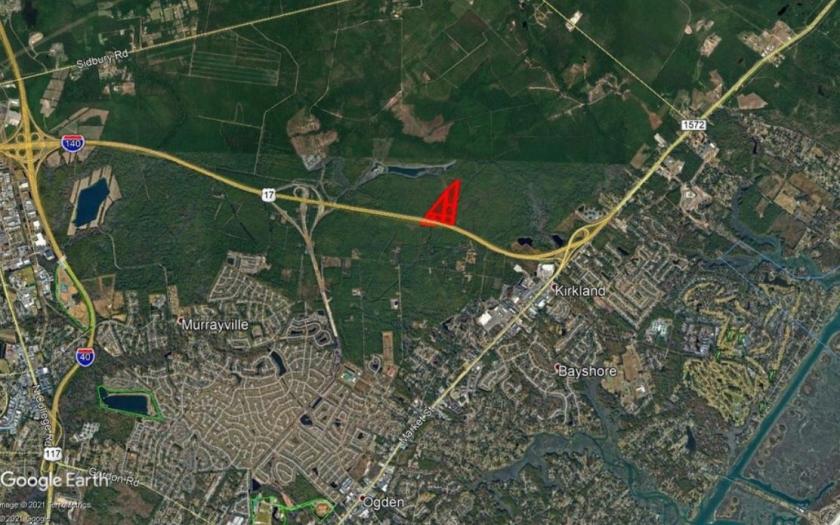
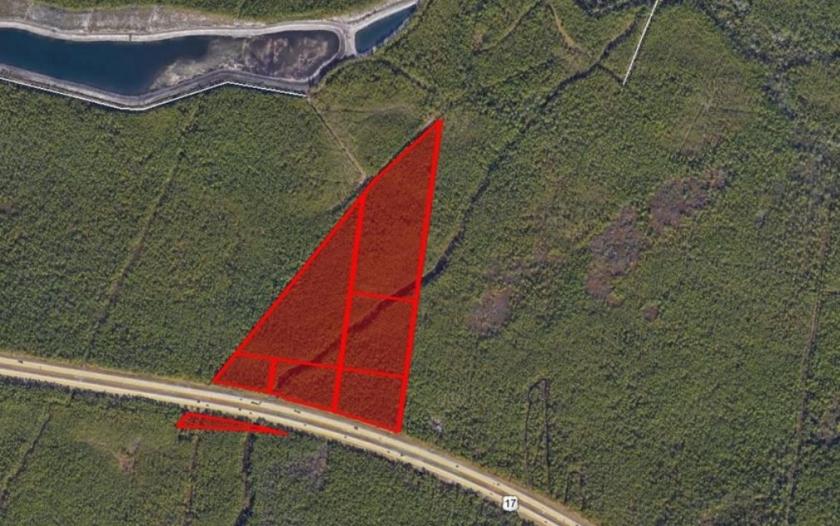
1-Mile | 3-Miles | 5-Miles | ||
---|---|---|---|---|
Total Population | 1,546 | 23,593 | 56,707 | |
Population Median Age | 32 | 40 | 41 | |
Population by Age | 0-9 Yrs | 302 (19%) | 2910 (12%) | 6183 (10%) |
10-19 Yrs | 198 (12%) | 2659 (11%) | 6375 (11%) | |
20-29 Yrs | 279 (18%) | 2577 (10%) | 6751 (11%) | |
30-39 Yrs | 246 (15%) | 3705 (15%) | 7998 (14%) | |
40-49 Yrs | 130 (8%) | 3321 (14%) | 7825 (13%) | |
50-59 Yrs | 179 (11%) | 3005 (12%) | 7563 (13%) | |
60-69 Yrs | 117 (7%) | 2771 (11%) | 7072 (12%) | |
70+ Yrs | 94 (6%) | 2643 (11%) | 6940 (12%) | |
Median HH Income | $44,262 | $70,942 | $71,822 | |
Total Household Income | < 24K | 58 (10%) | 1268 (13%) | 2956 (13%) |
25-49K | 251 (44%) | 1925 (20%) | 4687 (20%) | |
50-74K | 79 (13%) | 1761 (18%) | 4210 (18%) | |
75-99K | 101 (17%) | 1263 (13%) | 2998 (13%) | |
100-199K | 73 (12%) | 2435 (26%) | 5816 (25%) | |
200K+ | 4 (0%) | 669 (7%) | 1973 (8%) | |
Highest Education Level | No Diploma | 79 | 973 | 2213 |
Diploma or GED | 179 | 3481 | 8657 | |
Some College | 310 | 3749 | 8578 | |
Assoc. Degree | 82 | 1444 | 3589 | |
Bachelors Degree | 162 | 4478 | 11572 | |
Higher Degree | 87 | 2660 | 5881 | |
Total Housing Units | 571 | 9,761 | 24,659 | |
--Owner-Occupied | 260 | 7,065 | 16,902 | |
--Renter-Occupied | 305 | 2,256 | 5,739 | |
Owner-Occupied Values | < 100K | 74 | 365 | 874 |
100-199K | 114 | 2144 | 4608 | |
200-299K | 48 | 1946 | 4364 | |
300-399K | 5 | 1374 | 2918 | |
400-499K | 18 | 592 | 1508 | |
500K+ | 1 | 644 | 2630 | |
Total Working Age Population | 1,182 | 19,260 | 46,870 | |
In Work Force | 857 | 12,701 | 30,217 | |
Not In Work Force | 325 | 6,559 | 16,653 | |
Workforce Employed | 801 | 12,025 | 28,894 | |
Workforce Unemployed | 38 | 547 | 1,153 | |
Civlian Workforce | 839 | 12,572 | 30,047 | |
Military Workforce | 19 | 129 | 170 | |
Total Households | 565 | 9,321 | 22,641 | |
Family Households | 401 | 6,412 | 15,223 | |
Non-Family Households | 164 | 2,908 | 7,417 | |
Married Couple | 311 | 5,255 | 12,574 | |
Other Family | 90 | 1,157 | 2,650 | |
Married w/Child | 105 | 2,035 | 4,960 | |
Single Male w/Child | 65 | 292 | 520 | |
Single Female w/Child | 21 | 426 | 943 |
Population Change Last Two Decades - Plus Projection
2000 | % | 2010 | % | 2020 | % | 2030 | |
---|---|---|---|---|---|---|---|
North Carolina | 8,049,313 | +18 | 9,535,483 | +11 | 10,630,691 | +11 | 11,836,070 |
New Hanover County | 160,307 | +26 | 202,667 | +18 | 239,272 | +16 | 276,409 |
Pender County | 41,082 | +27 | 52,217 | +24 | 64,578 | +18 | 76,106 |
Total Working Age Population:
Total Households:
Total Working Age Population:
Total Households:
Total Working Age Population:
Total Households: