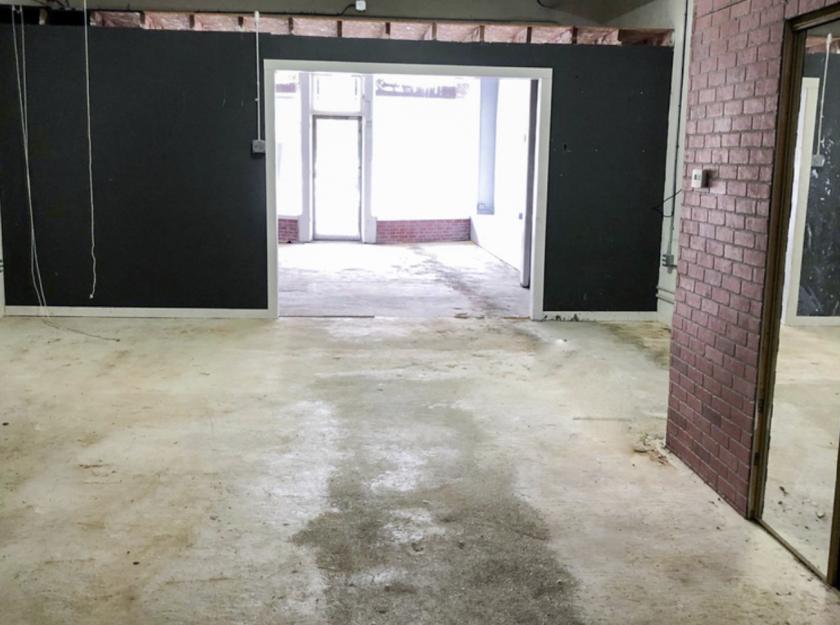
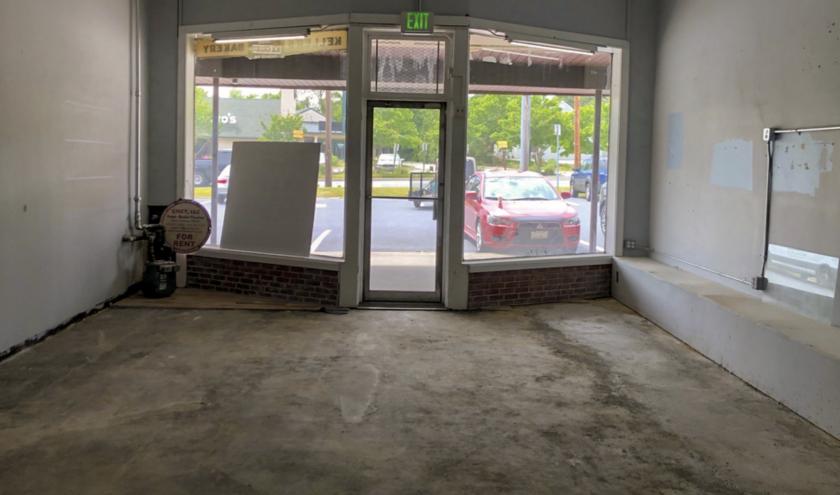
Retail Space
501 South Camp Meade Road Linthicum Heights, MD 21090
501 South Camp Meade Road Linthicum Heights, MD 21090
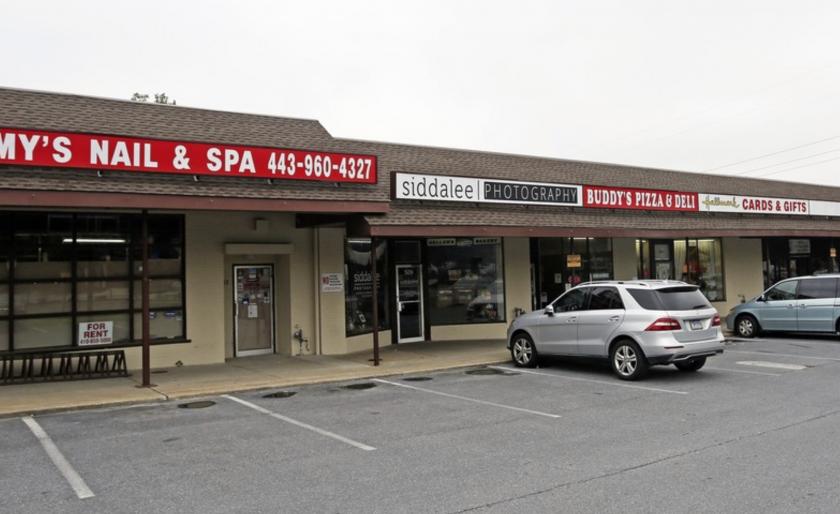
Details & Description
Property Highlights
- • Ample free parking
- • Recently renovated in 2015
- • BGE gas heat
Listing Agents

Susan Rosko Thomas
O: 410-972-4000
M: 410-303-1551
susanrt@kwcommercial.com
O: 410-972-4000
M: 410-303-1551
susanrt@kwcommercial.com
While we strive to provide the most accurate information, all listing information, and demographic data, is provided by third-parties. As such, MyEListing will not be responsible for the accuracy of the information. It is strongly recommended that you verify all information with the listing agent, and any relevant agencies, prior to making any decisions.