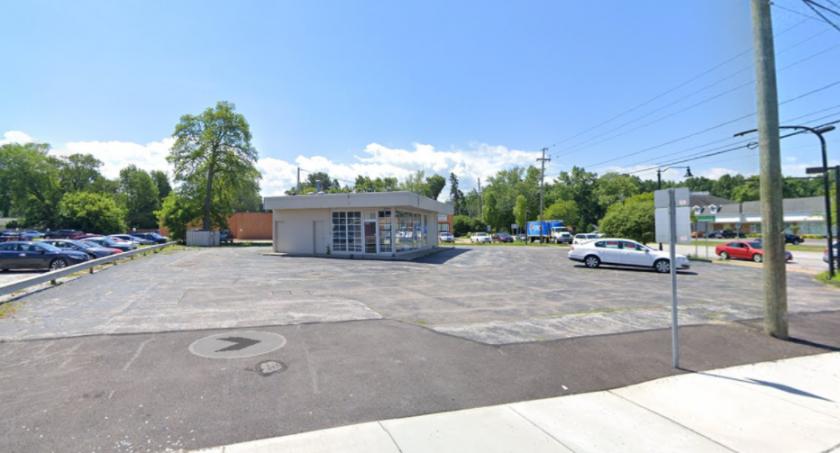
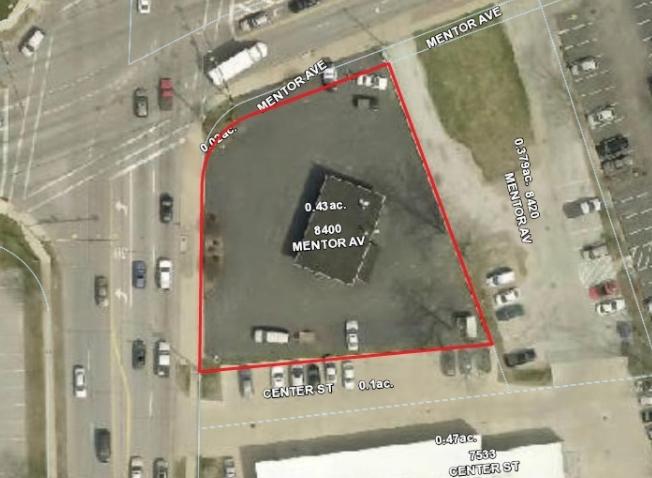
1-Mile | 3-Miles | 5-Miles | ||
---|---|---|---|---|
Total Population | 4,152 | 41,922 | 102,879 | |
Population Median Age | 45 | 45 | 43 | |
Population by Age | 0-9 Yrs | 341 (8%) | 4011 (9%) | 9841 (9%) |
10-19 Yrs | 492 (11%) | 4630 (11%) | 12018 (11%) | |
20-29 Yrs | 435 (10%) | 3972 (9%) | 11379 (11%) | |
30-39 Yrs | 549 (13%) | 4512 (10%) | 11168 (10%) | |
40-49 Yrs | 401 (9%) | 4711 (11%) | 12578 (12%) | |
50-59 Yrs | 528 (12%) | 6313 (15%) | 16213 (15%) | |
60-69 Yrs | 591 (14%) | 6990 (16%) | 15445 (15%) | |
70+ Yrs | 814 (19%) | 6783 (16%) | 14235 (13%) | |
Median HH Income | $63,791 | $73,376 | $70,194 | |
Total Household Income | < 24K | 281 (15%) | 2027 (11%) | 5674 (13%) |
25-49K | 448 (24%) | 4162 (23%) | 9616 (22%) | |
50-74K | 317 (17%) | 2841 (16%) | 7865 (18%) | |
75-99K | 272 (14%) | 2812 (15%) | 6765 (15%) | |
100-199K | 448 (24%) | 4688 (26%) | 11028 (25%) | |
200K+ | 64 (3%) | 1191 (6%) | 2478 (5%) | |
Highest Education Level | No Diploma | 247 | 2138 | 4875 |
Diploma or GED | 791 | 8550 | 22249 | |
Some College | 734 | 6943 | 17232 | |
Assoc. Degree | 258 | 3166 | 7556 | |
Bachelors Degree | 625 | 6554 | 15203 | |
Higher Degree | 437 | 3908 | 8321 | |
Total Housing Units | 1,958 | 18,707 | 45,788 | |
--Owner-Occupied | 1,329 | 14,745 | 33,812 | |
--Renter-Occupied | 501 | 2,976 | 9,614 | |
Owner-Occupied Values | < 100K | 160 | 1860 | 4740 |
100-199K | 702 | 6916 | 16288 | |
200-299K | 253 | 4281 | 8897 | |
300-399K | 174 | 1121 | 2296 | |
400-499K | 36 | 281 | 736 | |
500K+ | 4 | 286 | 855 | |
Total Working Age Population | 3,519 | 34,885 | 85,556 | |
In Work Force | 2,158 | 22,035 | 56,080 | |
Not In Work Force | 1,361 | 12,850 | 29,476 | |
Workforce Employed | 2,094 | 21,336 | 54,069 | |
Workforce Unemployed | 65 | 697 | 1,982 | |
Civlian Workforce | 2,158 | 22,033 | 56,051 | |
Military Workforce | 0 | 2 | 29 | |
Total Households | 1,830 | 17,721 | 43,426 | |
Family Households | 1,050 | 11,434 | 28,053 | |
Non-Family Households | 780 | 6,287 | 15,373 | |
Married Couple | 761 | 9,349 | 22,032 | |
Other Family | 289 | 2,086 | 6,021 | |
Married w/Child | 239 | 3,120 | 7,432 | |
Single Male w/Child | 31 | 311 | 941 | |
Single Female w/Child | 75 | 507 | 1,929 |
Population Change Last Two Decades - Plus Projection
2000 | % | 2010 | % | 2020 | % | 2030 | |
---|---|---|---|---|---|---|---|
Ohio | 11,353,140 | +2 | 11,536,504 | 0 | 11,574,870 | 0 | 11,615,100 |
Cuyahoga County | 1,393,978 | -8 | 1,280,122 | -6 | 1,209,550 | -5 | 1,154,210 |
Geauga County | 90,895 | +3 | 93,389 | 0 | 93,510 | +2 | 94,930 |
Lake County | 227,511 | +1 | 230,041 | -1 | 228,600 | 0 | 228,380 |
Total Working Age Population:
Total Households:
Total Working Age Population:
Total Households:
Total Working Age Population:
Total Households: