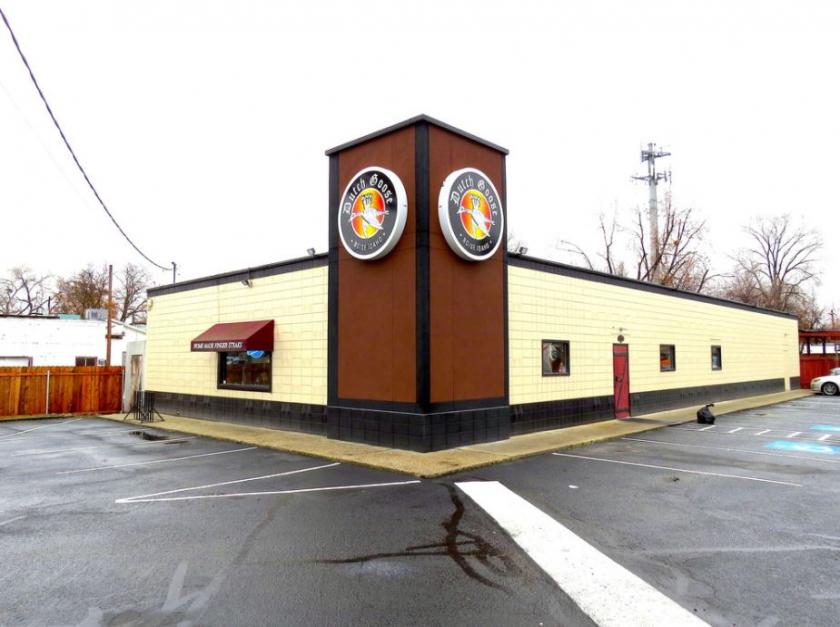
Retail Space
3515 West State Street Boise, ID 83703
3515 West State Street Boise, ID 83703
Details & Description
Property Highlights
- • Major remodel in 2019
- • Excellent access with plenty of parking
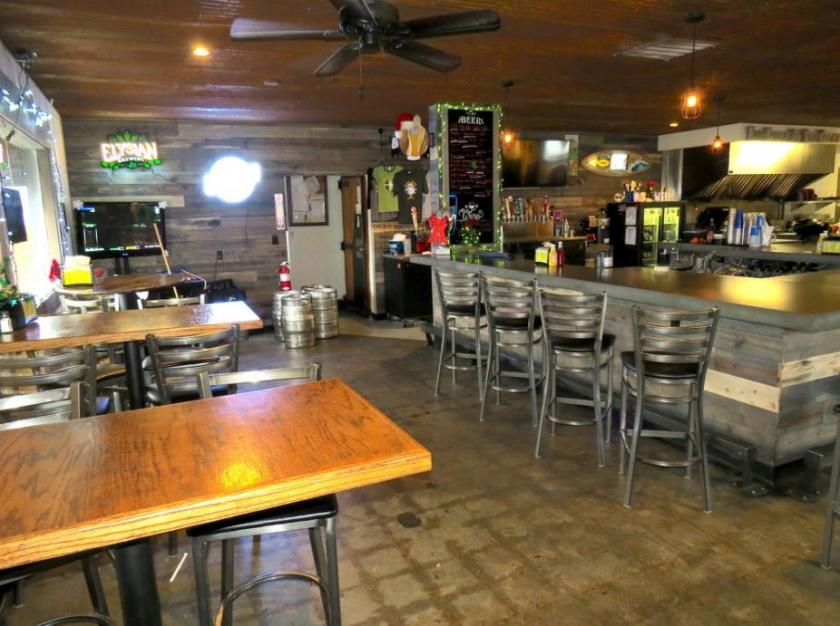
- • Live music potential both indoor and outdoor
- • Support and training available
- • Please contact agent for showing
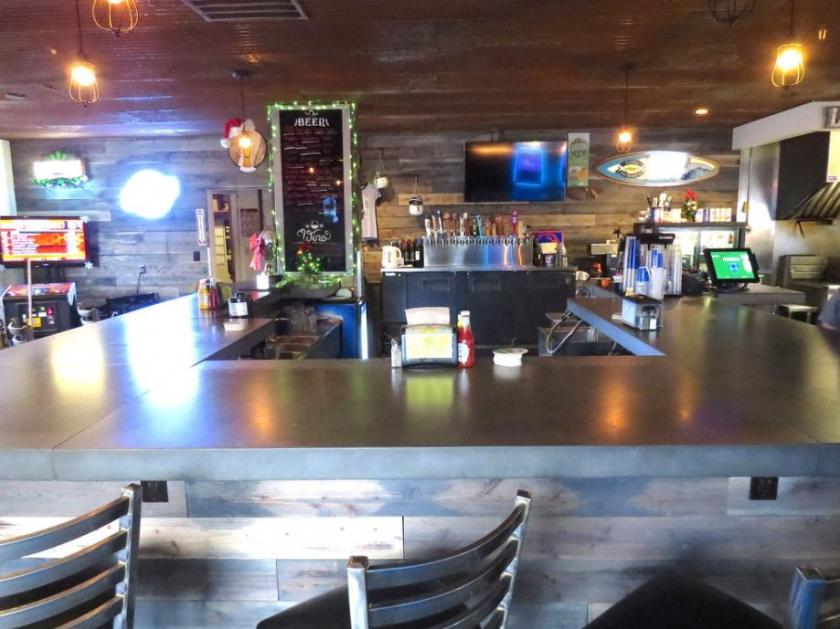
Additional Photos

Listing Agents

Chris Novak
KW Commercial
O: 208-869-4713
cnovak14@yahoo.com
KW Commercial
O: 208-869-4713
cnovak14@yahoo.com
While we strive to provide the most accurate information, all listing information, and demographic data, is provided by third-parties. As such, MyEListing will not be responsible for the accuracy of the information. It is strongly recommended that you verify all information with the listing agent, and any relevant agencies, prior to making any decisions.


