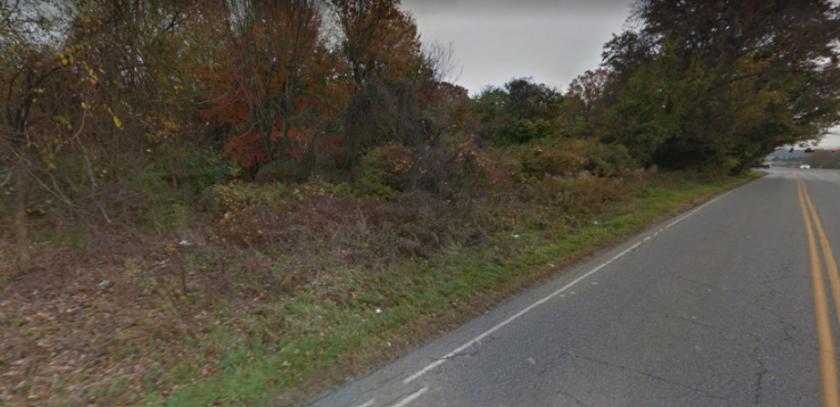
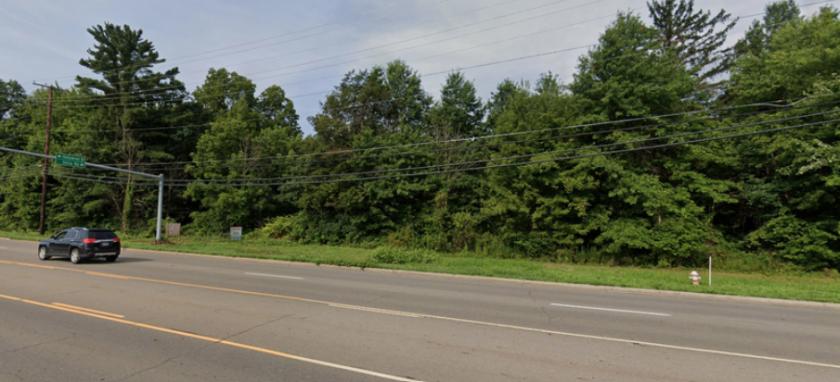
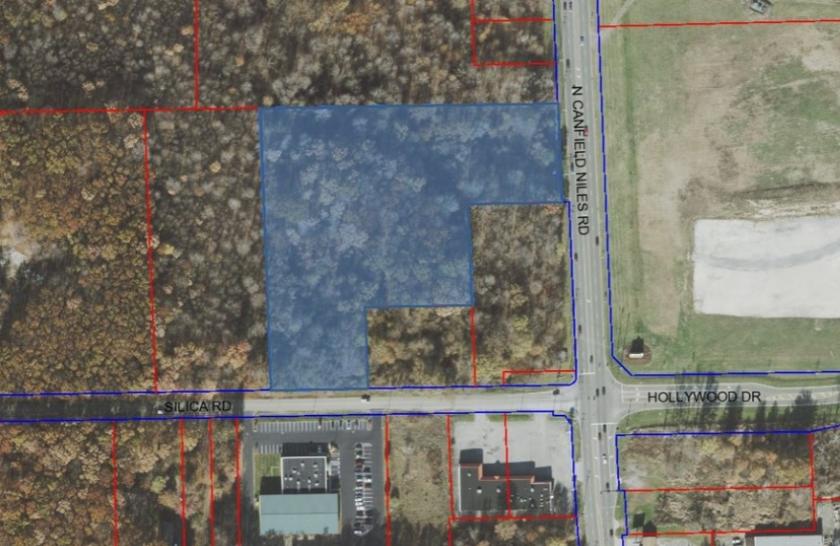
1-Mile | 3-Miles | 5-Miles | ||
---|---|---|---|---|
Total Population | 5,176 | 36,769 | 81,742 | |
Population Median Age | 47 | 43 | 42 | |
Population by Age | 0-9 Yrs | 461 (8%) | 3668 (9%) | 8627 (10%) |
10-19 Yrs | 318 (6%) | 3866 (10%) | 8805 (10%) | |
20-29 Yrs | 651 (12%) | 5111 (13%) | 10489 (12%) | |
30-39 Yrs | 610 (11%) | 4296 (11%) | 9197 (11%) | |
40-49 Yrs | 524 (10%) | 4490 (12%) | 9769 (11%) | |
50-59 Yrs | 655 (12%) | 4591 (12%) | 11257 (13%) | |
60-69 Yrs | 772 (14%) | 5243 (14%) | 11969 (14%) | |
70+ Yrs | 1184 (22%) | 5503 (14%) | 11629 (14%) | |
Median HH Income | $43,758 | $50,060 | $47,812 | |
Total Household Income | < 24K | 620 (23%) | 3538 (21%) | 9396 (26%) |
25-49K | 846 (32%) | 4541 (28%) | 9368 (26%) | |
50-74K | 431 (16%) | 2820 (17%) | 6195 (17%) | |
75-99K | 353 (13%) | 2332 (14%) | 4634 (12%) | |
100-199K | 338 (12%) | 2518 (15%) | 5247 (14%) | |
200K+ | 38 (1%) | 427 (2%) | 1078 (3%) | |
Highest Education Level | No Diploma | 342 | 1774 | 4740 |
Diploma or GED | 1804 | 10785 | 22775 | |
Some College | 691 | 5718 | 12381 | |
Assoc. Degree | 328 | 2180 | 4892 | |
Bachelors Degree | 597 | 4221 | 9695 | |
Higher Degree | 351 | 2100 | 4713 | |
Total Housing Units | 2,946 | 17,836 | 39,667 | |
--Owner-Occupied | 1,679 | 10,925 | 24,934 | |
--Renter-Occupied | 947 | 5,250 | 10,984 | |
Owner-Occupied Values | < 100K | 841 | 4689 | 12137 |
100-199K | 595 | 5068 | 9036 | |
200-299K | 189 | 757 | 2254 | |
300-399K | 21 | 180 | 797 | |
400-499K | 18 | 143 | 361 | |
500K+ | 15 | 88 | 348 | |
Total Working Age Population | 4,447 | 30,716 | 67,476 | |
In Work Force | 2,632 | 19,539 | 41,558 | |
Not In Work Force | 1,816 | 11,177 | 25,918 | |
Workforce Employed | 2,460 | 18,359 | 38,929 | |
Workforce Unemployed | 171 | 1,175 | 2,605 | |
Civlian Workforce | 2,632 | 19,533 | 41,534 | |
Military Workforce | 0 | 6 | 24 | |
Total Households | 2,626 | 16,175 | 35,918 | |
Family Households | 1,274 | 9,877 | 21,592 | |
Non-Family Households | 1,352 | 6,299 | 14,325 | |
Married Couple | 955 | 7,256 | 15,005 | |
Other Family | 319 | 2,621 | 6,588 | |
Married w/Child | 287 | 2,309 | 4,582 | |
Single Male w/Child | 60 | 349 | 689 | |
Single Female w/Child | 34 | 866 | 2,653 |
Population Change Last Two Decades - Plus Projection
2000 | % | 2010 | % | 2020 | % | 2030 | |
---|---|---|---|---|---|---|---|
Ohio | 11,353,140 | +2 | 11,536,504 | 0 | 11,574,870 | 0 | 11,615,100 |
Mahoning County | 257,555 | -7 | 238,823 | -6 | 224,680 | -6 | 212,240 |
Trumbull County | 225,116 | -7 | 210,312 | -5 | 200,840 | -4 | 193,360 |
Total Working Age Population:
Total Households:
Total Working Age Population:
Total Households:
Total Working Age Population:
Total Households: