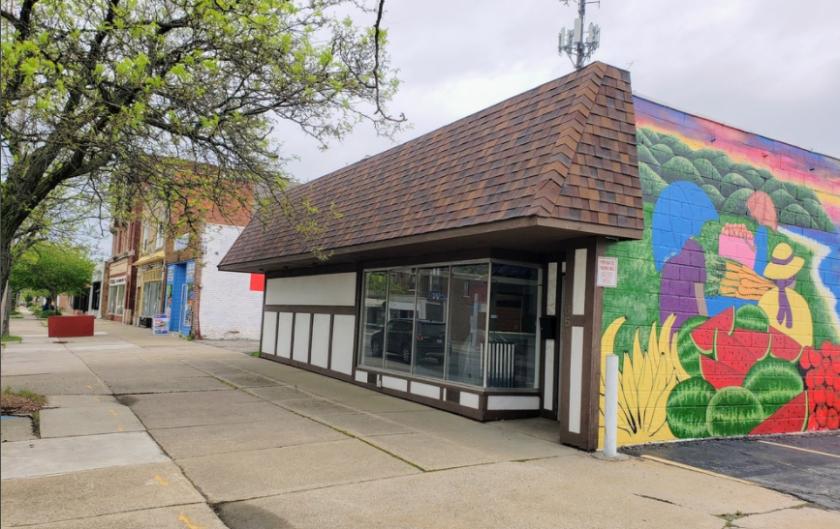
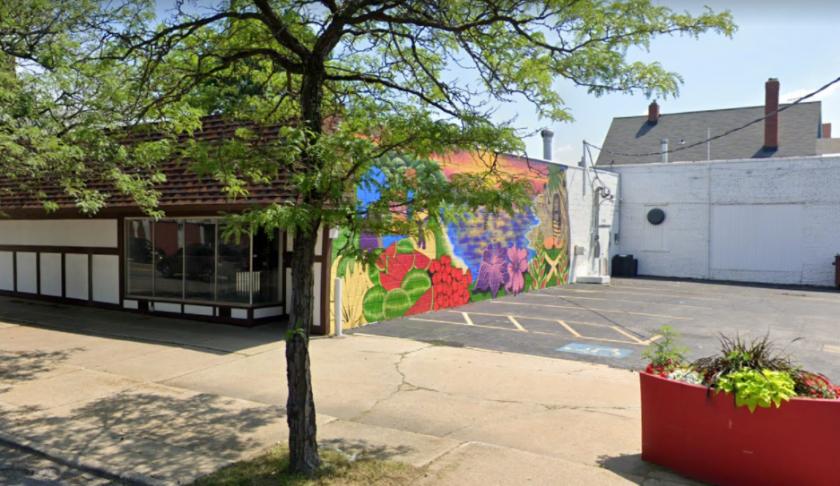
Retail Space
651 East 185th Street Euclid, OH 44119
651 East 185th Street Euclid, OH 44119
Details & Description
Property Highlights
• Old World neighborhood retail property former Euclid Fish and Old World Meats in Euclids 185th Neighborhood
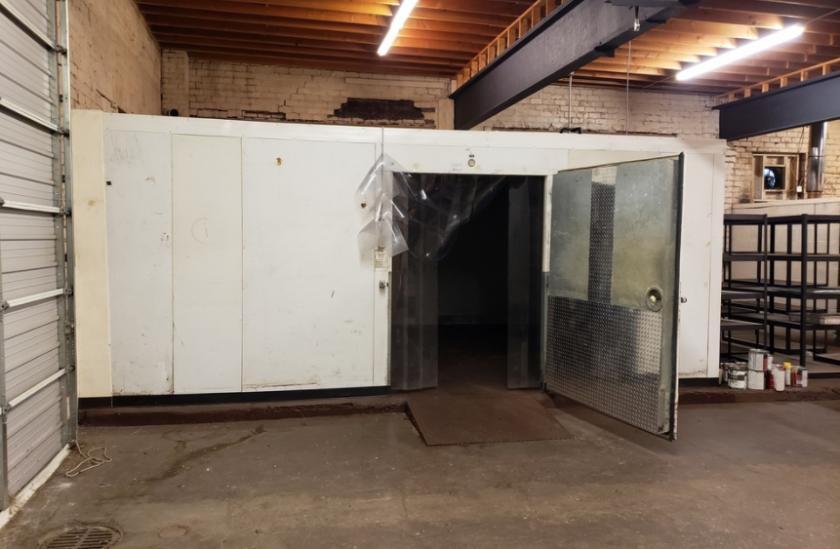
• Walk-in coolers and freezers included in sale
Listing Agents

Rick Osborne Jr.
O: 440-299-5190
M: 216-219-0290
rick.osbornejr@kw.com
O: 440-299-5190
M: 216-219-0290
rick.osbornejr@kw.com
While we strive to provide the most accurate information, all listing information, and demographic data, is provided by third-parties. As such, MyEListing will not be responsible for the accuracy of the information. It is strongly recommended that you verify all information with the listing agent, and any relevant agencies, prior to making any decisions.