Commercial Land
301 Olive Street Grand River, OH 44045
301 Olive Street Grand River, OH 44045
Details & Description
Property Highlights
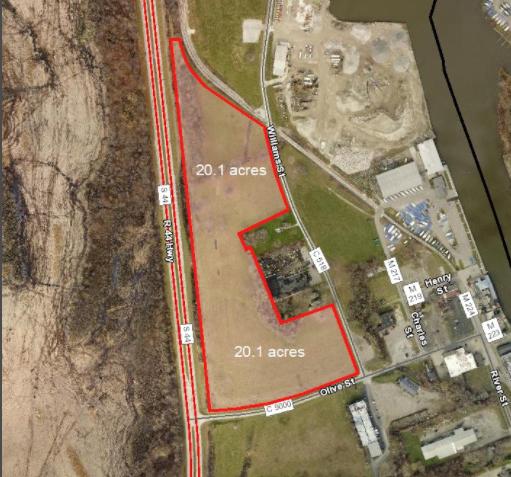
- • $60,000.00 per acre.
- • Great easy highway access off of Rt 44 I 90.
- • Rail access to the north for possible siding.
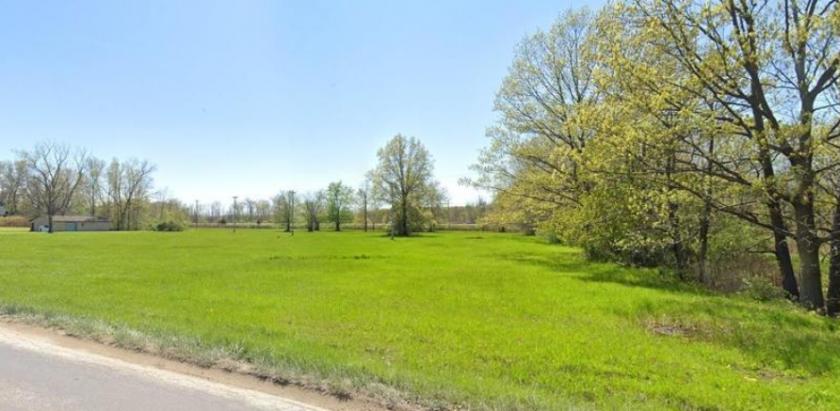
- • Level and cleared
Listing Agents

Rick Osborne Jr.
O: 440-299-5190
M: 216-219-0290
rick.osbornejr@kw.com
O: 440-299-5190
M: 216-219-0290
rick.osbornejr@kw.com
While we strive to provide the most accurate information, all listing information, and demographic data, is provided by third-parties. As such, MyEListing will not be responsible for the accuracy of the information. It is strongly recommended that you verify all information with the listing agent, and any relevant agencies, prior to making any decisions.