Commercial Land
5840 US-287 Midlothian, TX 76065
5840 US-287 Midlothian, TX 76065
Details & Description
Property Highlights
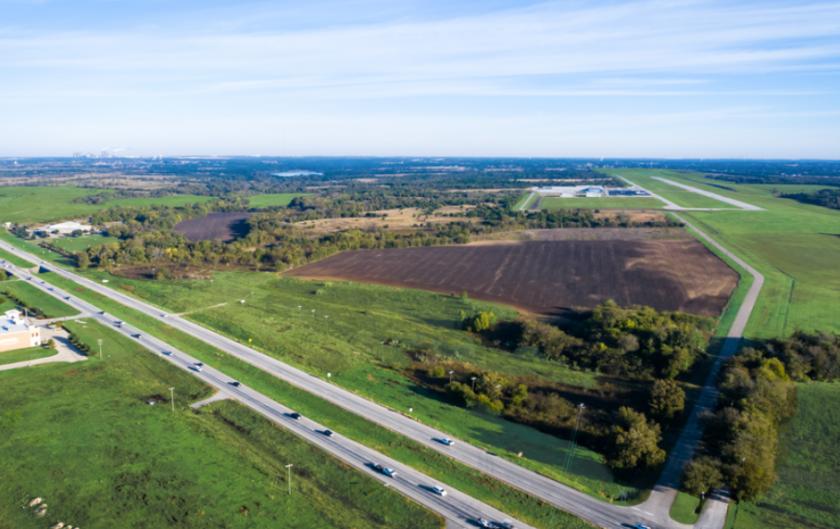
• Improved Highways TxDOT Service Road Additions to US 287 through Ellis County from Mansfield to Ennis
• New Hospitals Baylor Scott White, Waxahachie and Methodist Medical Center, Midlothian
Listing Agents

Steve Madison
O: 972-874-1905
M: 972-207-4310
smadison@kwcommercial.com
O: 972-874-1905
M: 972-207-4310
smadison@kwcommercial.com

TJ McNeece
M: 972-755-3734
tjmcneece@kwcommercial.com
M: 972-755-3734
tjmcneece@kwcommercial.com
While we strive to provide the most accurate information, all listing information, and demographic data, is provided by third-parties. As such, MyEListing will not be responsible for the accuracy of the information. It is strongly recommended that you verify all information with the listing agent, and any relevant agencies, prior to making any decisions.