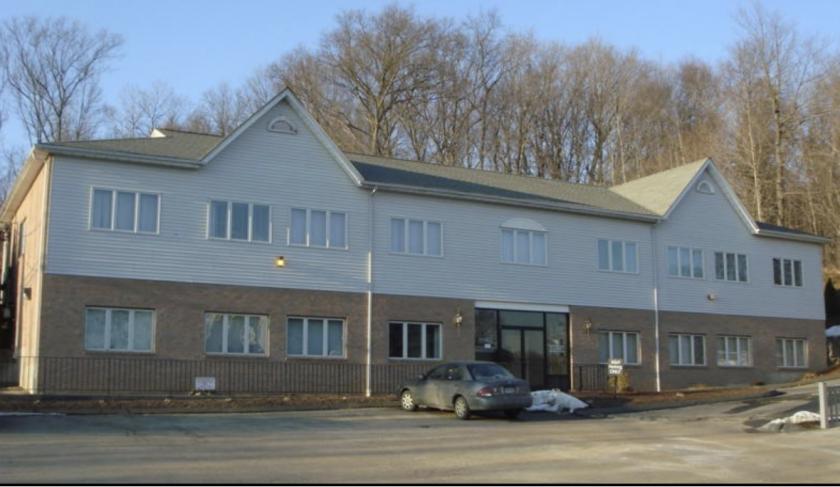
1-Mile | 3-Miles | 5-Miles | ||
---|---|---|---|---|
Total Population | 5,009 | 77,144 | 155,878 | |
Population Median Age | 41 | 37 | 39 | |
Population by Age | 0-9 Yrs | 476 (9%) | 10311 (13%) | 19924 (12%) |
10-19 Yrs | 520 (10%) | 10167 (13%) | 19370 (12%) | |
20-29 Yrs | 857 (17%) | 12187 (15%) | 22239 (14%) | |
30-39 Yrs | 658 (13%) | 9376 (12%) | 20138 (12%) | |
40-49 Yrs | 562 (11%) | 9812 (12%) | 19784 (12%) | |
50-59 Yrs | 649 (12%) | 10055 (13%) | 21419 (13%) | |
60-69 Yrs | 578 (11%) | 7448 (9%) | 17129 (10%) | |
70+ Yrs | 709 (14%) | 7788 (10%) | 15876 (10%) | |
Median HH Income | $66,300 | $44,242 | $53,444 | |
Total Household Income | < 24K | 297 (15%) | 8783 (30%) | 14506 (24%) |
25-49K | 442 (22%) | 6857 (23%) | 13410 (22%) | |
50-74K | 290 (15%) | 4145 (14%) | 9278 (15%) | |
75-99K | 248 (12%) | 3232 (11%) | 7028 (11%) | |
100-199K | 533 (27%) | 4874 (16%) | 11738 (19%) | |
200K+ | 122 (6%) | 1151 (3%) | 2908 (4%) | |
Highest Education Level | No Diploma | 402 | 9962 | 17004 |
Diploma or GED | 1112 | 17560 | 36335 | |
Some College | 550 | 9730 | 20435 | |
Assoc. Degree | 200 | 3630 | 8541 | |
Bachelors Degree | 736 | 5601 | 13292 | |
Higher Degree | 533 | 4146 | 9763 | |
Total Housing Units | 2,124 | 33,976 | 67,181 | |
--Owner-Occupied | 1,389 | 13,820 | 31,171 | |
--Renter-Occupied | 544 | 15,222 | 27,697 | |
Owner-Occupied Values | < 100K | 208 | 3161 | 5432 |
100-199K | 704 | 6224 | 14141 | |
200-299K | 312 | 2755 | 7111 | |
300-399K | 87 | 889 | 2524 | |
400-499K | 14 | 333 | 880 | |
500K+ | 64 | 458 | 1083 | |
Total Working Age Population | 4,317 | 60,693 | 124,176 | |
In Work Force | 2,816 | 37,994 | 79,856 | |
Not In Work Force | 1,501 | 22,699 | 44,320 | |
Workforce Employed | 2,705 | 34,243 | 73,333 | |
Workforce Unemployed | 110 | 3,690 | 6,451 | |
Civlian Workforce | 2,815 | 37,933 | 79,784 | |
Military Workforce | 0 | 61 | 72 | |
Total Households | 1,933 | 29,042 | 58,867 | |
Family Households | 1,170 | 17,711 | 37,680 | |
Non-Family Households | 763 | 11,331 | 21,187 | |
Married Couple | 844 | 10,001 | 23,183 | |
Other Family | 326 | 7,710 | 14,498 | |
Married w/Child | 318 | 4,127 | 9,046 | |
Single Male w/Child | 24 | 663 | 1,268 | |
Single Female w/Child | 45 | 3,453 | 6,137 |
Population Change Last Two Decades - Plus Projection
2000 | % | 2010 | % | 2020 | % | 2030 | |
---|---|---|---|---|---|---|---|
Connecticut | 3,405,565 | +5 | 3,574,097 | +1 | 3,604,603 | +1 | 3,633,994 |
Fairfield County | 882,567 | +4 | 916,829 | -1 | 907,603 | -1 | 897,553 |
Hartford County | 857,183 | +4 | 894,014 | +2 | 909,671 | +2 | 930,629 |
Litchfield County | 182,193 | +4 | 189,927 | -2 | 186,611 | -3 | 180,866 |
New Haven County | 824,008 | +5 | 862,477 | +1 | 873,659 | +2 | 891,371 |
Total Working Age Population:
Total Households:
Total Working Age Population:
Total Households:
Total Working Age Population:
Total Households: