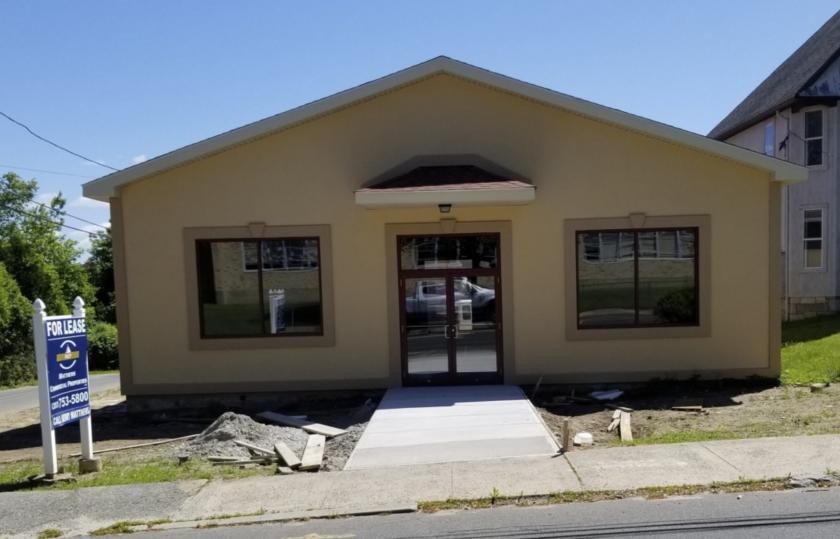
1-Mile | 3-Miles | 5-Miles | ||
---|---|---|---|---|
Total Population | 13,654 | 94,463 | 167,363 | |
Population Median Age | 36 | 37 | 38 | |
Population by Age | 0-9 Yrs | 2043 (14%) | 12677 (13%) | 21771 (13%) |
10-19 Yrs | 1588 (11%) | 12961 (13%) | 20672 (12%) | |
20-29 Yrs | 2713 (19%) | 14501 (15%) | 23787 (14%) | |
30-39 Yrs | 1630 (11%) | 11949 (12%) | 21669 (12%) | |
40-49 Yrs | 1451 (10%) | 12386 (13%) | 21106 (12%) | |
50-59 Yrs | 1795 (13%) | 11728 (12%) | 23270 (13%) | |
60-69 Yrs | 1158 (8%) | 9206 (9%) | 18231 (10%) | |
70+ Yrs | 1276 (9%) | 9056 (9%) | 16857 (10%) | |
Median HH Income | $37,568 | $43,611 | $54,218 | |
Total Household Income | < 24K | 1926 (34%) | 10850 (30%) | 15461 (24%) |
25-49K | 1580 (28%) | 8684 (24%) | 14073 (22%) | |
50-74K | 591 (10%) | 5503 (15%) | 9966 (15%) | |
75-99K | 710 (12%) | 3954 (11%) | 7741 (12%) | |
100-199K | 607 (10%) | 5495 (15%) | 12779 (20%) | |
200K+ | 141 (2%) | 1038 (2%) | 2998 (4%) | |
Highest Education Level | No Diploma | 1695 | 12520 | 17915 |
Diploma or GED | 3495 | 21963 | 39328 | |
Some College | 1614 | 11986 | 22236 | |
Assoc. Degree | 398 | 4422 | 9087 | |
Bachelors Degree | 954 | 6329 | 14183 | |
Higher Degree | 573 | 4302 | 10211 | |
Total Housing Units | 6,599 | 41,543 | 71,557 | |
--Owner-Occupied | 1,906 | 15,688 | 33,494 | |
--Renter-Occupied | 3,649 | 19,836 | 29,525 | |
Owner-Occupied Values | < 100K | 462 | 4035 | 5659 |
100-199K | 1159 | 8018 | 15355 | |
200-299K | 216 | 2439 | 7906 | |
300-399K | 25 | 613 | 2759 | |
400-499K | 1 | 234 | 855 | |
500K+ | 42 | 349 | 960 | |
Total Working Age Population | 10,756 | 74,027 | 133,027 | |
In Work Force | 6,589 | 45,843 | 85,662 | |
Not In Work Force | 4,167 | 28,183 | 47,364 | |
Workforce Employed | 5,879 | 41,376 | 78,799 | |
Workforce Unemployed | 710 | 4,413 | 6,792 | |
Civlian Workforce | 6,589 | 45,789 | 85,591 | |
Military Workforce | 0 | 55 | 72 | |
Total Households | 5,555 | 35,525 | 63,018 | |
Family Households | 2,988 | 21,692 | 40,498 | |
Non-Family Households | 2,567 | 13,833 | 22,520 | |
Married Couple | 1,346 | 11,593 | 24,825 | |
Other Family | 1,642 | 10,099 | 15,673 | |
Married w/Child | 542 | 4,833 | 9,558 | |
Single Male w/Child | 328 | 879 | 1,311 | |
Single Female w/Child | 673 | 4,656 | 6,778 |
Population Change Last Two Decades - Plus Projection
2000 | % | 2010 | % | 2020 | % | 2030 | |
---|---|---|---|---|---|---|---|
Connecticut | 3,405,565 | +5 | 3,574,097 | +1 | 3,604,603 | +1 | 3,633,994 |
Fairfield County | 882,567 | +4 | 916,829 | -1 | 907,603 | -1 | 897,553 |
Hartford County | 857,183 | +4 | 894,014 | +2 | 909,671 | +2 | 930,629 |
Litchfield County | 182,193 | +4 | 189,927 | -2 | 186,611 | -3 | 180,866 |
New Haven County | 824,008 | +5 | 862,477 | +1 | 873,659 | +2 | 891,371 |
Total Working Age Population:
Total Households:
Total Working Age Population:
Total Households:
Total Working Age Population:
Total Households: