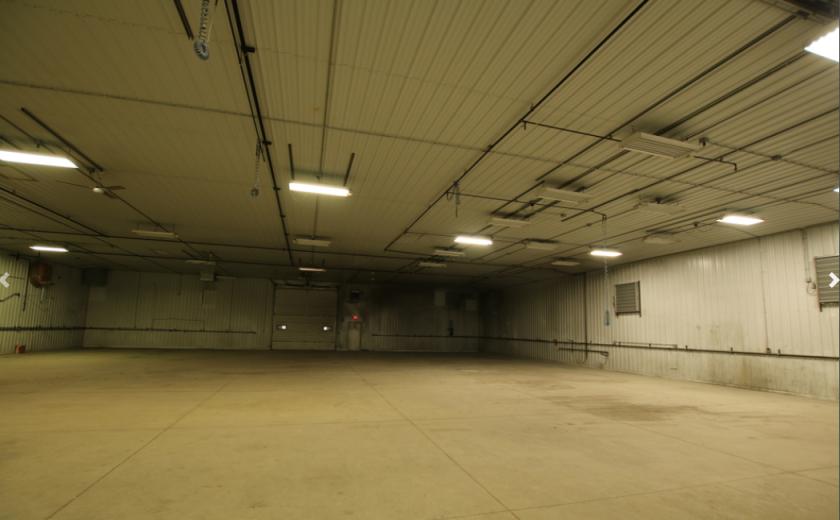
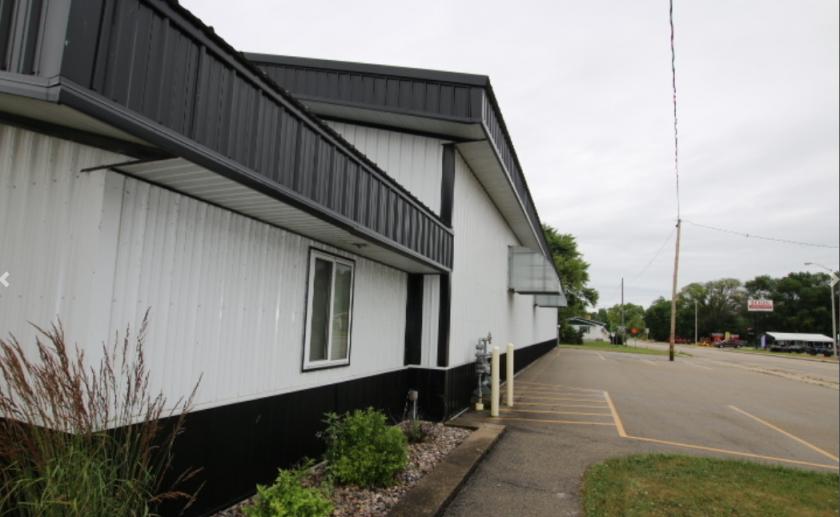
1-Mile | 3-Miles | 5-Miles | ||
---|---|---|---|---|
Total Population | 1,603 | 6,282 | 8,005 | |
Population Median Age | 38 | 40 | 41 | |
Population by Age | 0-9 Yrs | 223 (13%) | 808 (12%) | 987 (12%) |
10-19 Yrs | 199 (12%) | 772 (12%) | 978 (12%) | |
20-29 Yrs | 201 (12%) | 700 (11%) | 821 (10%) | |
30-39 Yrs | 240 (14%) | 785 (12%) | 960 (11%) | |
40-49 Yrs | 181 (11%) | 724 (11%) | 933 (11%) | |
50-59 Yrs | 192 (11%) | 884 (14%) | 1171 (14%) | |
60-69 Yrs | 199 (12%) | 837 (13%) | 1136 (14%) | |
70+ Yrs | 167 (10%) | 773 (12%) | 1019 (12%) | |
Median HH Income | $53,970 | $54,427 | $54,240 | |
Total Household Income | < 24K | 105 (15%) | 508 (18%) | 684 (19%) |
25-49K | 193 (28%) | 726 (26%) | 909 (26%) | |
50-74K | 172 (25%) | 652 (23%) | 796 (22%) | |
75-99K | 77 (11%) | 341 (12%) | 451 (12%) | |
100-199K | 107 (16%) | 450 (16%) | 582 (16%) | |
200K+ | 12 (1%) | 43 (1%) | 62 (1%) | |
Highest Education Level | No Diploma | 116 | 438 | 598 |
Diploma or GED | 425 | 1731 | 2272 | |
Some College | 230 | 865 | 1115 | |
Assoc. Degree | 88 | 371 | 488 | |
Bachelors Degree | 145 | 637 | 767 | |
Higher Degree | 77 | 298 | 372 | |
Total Housing Units | 759 | 3,005 | 3,865 | |
--Owner-Occupied | 470 | 1,909 | 2,494 | |
--Renter-Occupied | 196 | 810 | 990 | |
Owner-Occupied Values | < 100K | 208 | 682 | 813 |
100-199K | 180 | 854 | 1133 | |
200-299K | 38 | 218 | 323 | |
300-399K | 32 | 110 | 153 | |
400-499K | 5 | 20 | 33 | |
500K+ | 7 | 25 | 40 | |
Total Working Age Population | 1,263 | 5,019 | 6,433 | |
In Work Force | 830 | 3,219 | 4,073 | |
Not In Work Force | 434 | 1,800 | 2,360 | |
Workforce Employed | 799 | 3,110 | 3,917 | |
Workforce Unemployed | 30 | 109 | 155 | |
Civlian Workforce | 830 | 3,219 | 4,072 | |
Military Workforce | 0 | 0 | 1 | |
Total Households | 666 | 2,720 | 3,484 | |
Family Households | 425 | 1,651 | 2,147 | |
Non-Family Households | 240 | 1,068 | 1,337 | |
Married Couple | 317 | 1,303 | 1,711 | |
Other Family | 109 | 348 | 436 | |
Married w/Child | 141 | 532 | 666 | |
Single Male w/Child | 44 | 124 | 145 | |
Single Female w/Child | 23 | 105 | 141 |
Population Change Last Two Decades - Plus Projection
2000 | % | 2010 | % | 2020 | % | 2030 | |
---|---|---|---|---|---|---|---|
Wisconsin | 5,363,675 | +6 | 5,686,986 | +6 | 6,005,080 | +6 | 6,375,910 |
Fond du Lac County | 97,296 | +4 | 101,633 | +4 | 105,755 | +5 | 110,590 |
Green Lake County | 19,105 | 0 | 19,051 | +1 | 19,240 | +1 | 19,445 |
Waushara County | 23,154 | +6 | 24,496 | +6 | 25,860 | +9 | 28,230 |
Winnebago County | 156,763 | +7 | 166,994 | +6 | 177,050 | +7 | 188,680 |
Total Working Age Population:
Total Households:
Total Working Age Population:
Total Households:
Total Working Age Population:
Total Households: