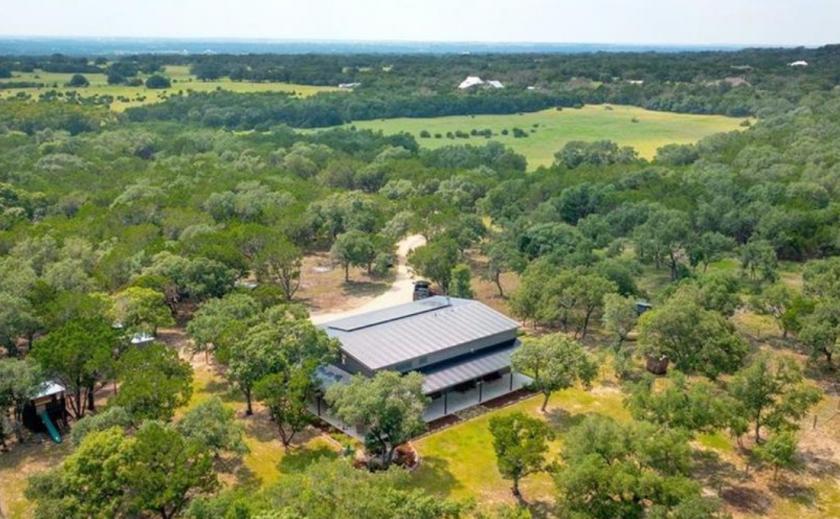
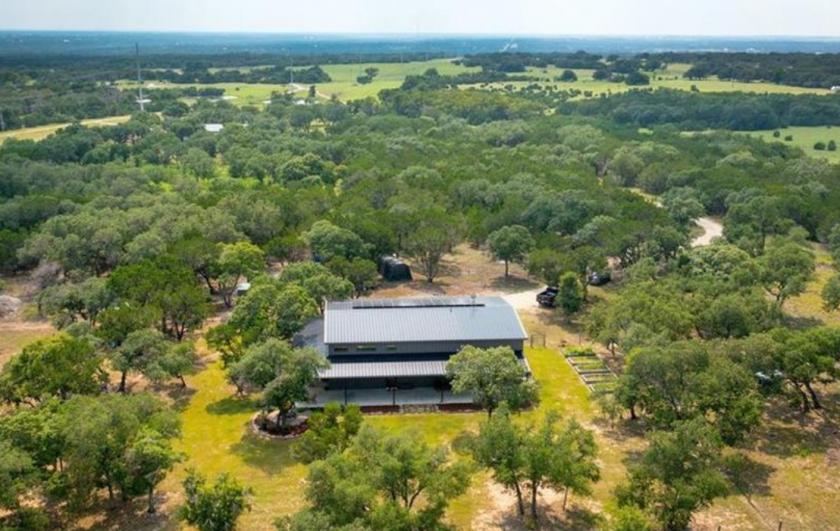
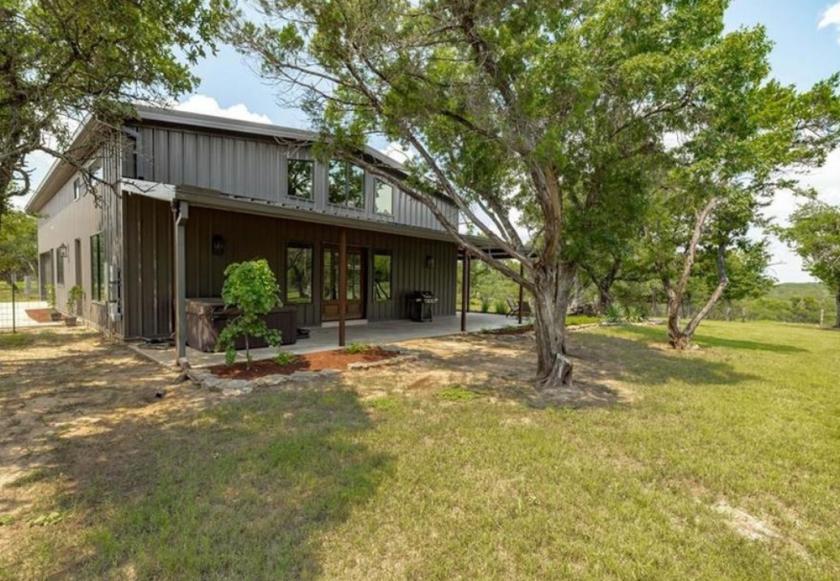
Located on 15.94 acres, this gorgeous hilltop barndominium provides exceptional privacy, seclusion, and never-ending panoramic Hill Country views from all vantage points of the home. This like new home encompasses two spacious bedrooms, one bathroom, and a sleek and stylish kitchen that flows through to the living room, dining room and enlarged covered patio. The home is a true testament that fantastic design and high-quality finishes that will stand the test of time! Entertaining is a breeze in the large kitchen complete with an over 8-foot-long kitchen island featuring high end quartz countertops and stainless steel appliances. Abundant windows and doors throughout illuminate the 18’ vaulted ceiling with views of the moon and stars at night. You will be hard-pressed to find a property that has been better maintained than this place. Fully enclosed yard (fenced in approximately an acre). Tons of room for playing, entertaining, gardening and more. Ag lease exemption in place for the cows - Feed the deer that come eat corn at night, and wake up to the baby cows, longhorns and horses at your window in the morning. Conventional Septic system, designed to be large enough for primary bedroom addition (plans and lists available of all current home selections for reference to match for features in case someone was to want to build on an addition). This beautiful Texas hill country land is filled with trees and within minutes to Leander, Liberty Hill and major thoroughfares. This luxurious setting is awaiting you to make the home your own. Just down the way from Fire Oak Distillery and Thirsty Mule Winery & Vineyard.