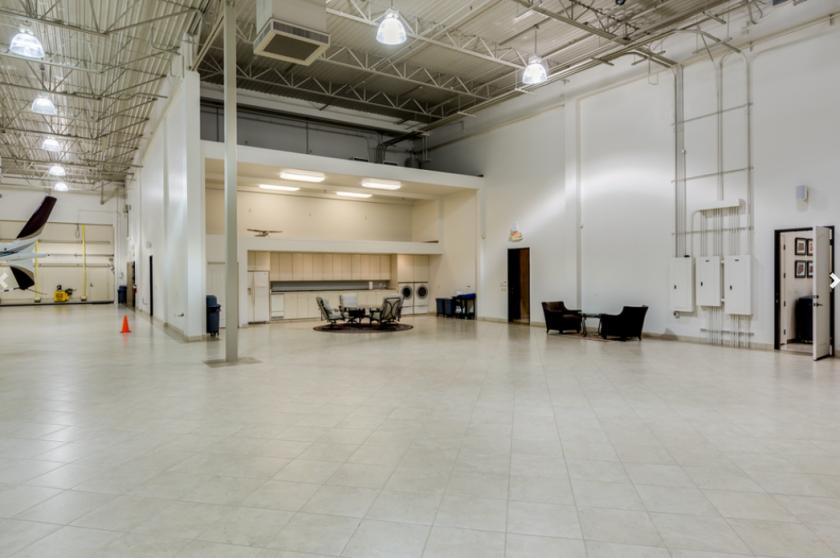
Office Space
4143 West Jupiter Way Chandler, AZ 85226
4143 West Jupiter Way Chandler, AZ 85226

Details & Description
Property Highlights
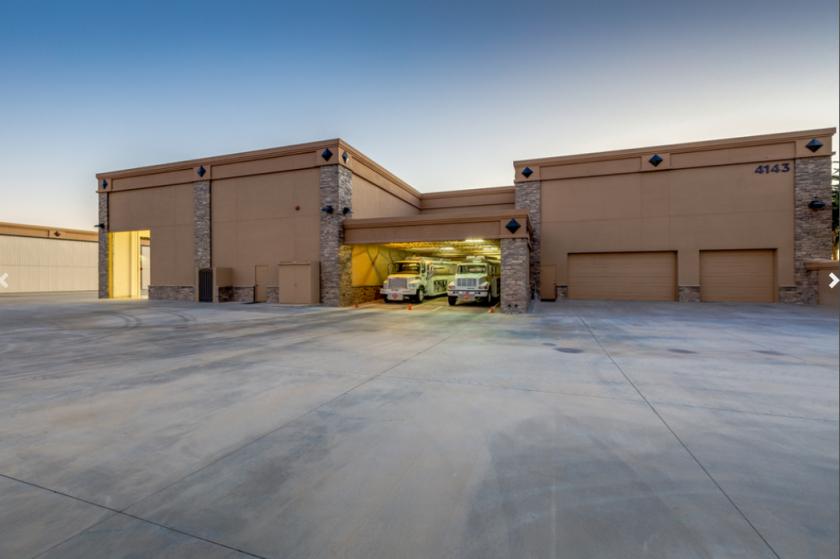
- • Hangar with 3 16 doors
- • Run Way access
- • Great opportunity as a hangar or Industrial
Additional Photos


Listing Agents

Andrew Monaghan
KW Commercial
O: 602-308-4660
M: 602-541-9416
andrew@themonaghangroup.com
KW Commercial
O: 602-308-4660
M: 602-541-9416
andrew@themonaghangroup.com
While we strive to provide the most accurate information, all listing information, and demographic data, is provided by third-parties. As such, MyEListing will not be responsible for the accuracy of the information. It is strongly recommended that you verify all information with the listing agent, and any relevant agencies, prior to making any decisions.


