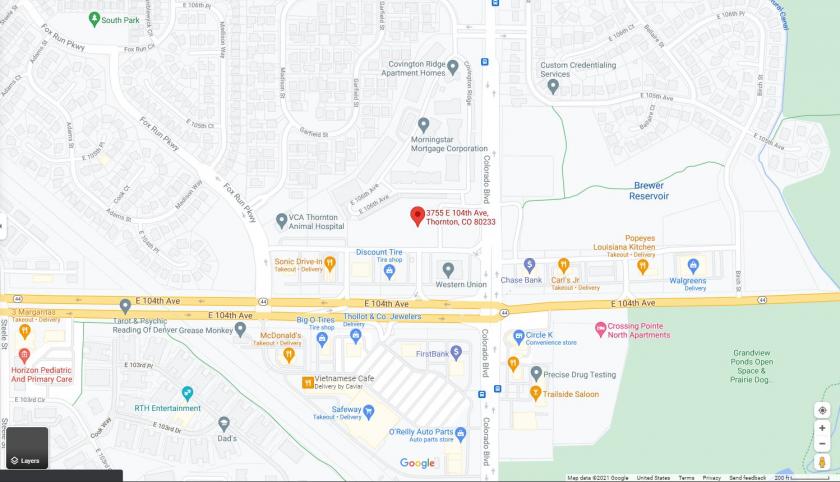
1-Mile | 3-Miles | 5-Miles | ||
---|---|---|---|---|
Total Population | 17,009 | 121,424 | 279,577 | |
Population Median Age | 32 | 34 | 34 | |
Population by Age | 0-9 Yrs | 2812 (16%) | 18542 (15%) | 42305 (15%) |
10-19 Yrs | 2641 (15%) | 17086 (14%) | 40339 (14%) | |
20-29 Yrs | 2850 (16%) | 19347 (15%) | 41518 (14%) | |
30-39 Yrs | 2927 (17%) | 20700 (17%) | 45586 (16%) | |
40-49 Yrs | 2223 (13%) | 14900 (12%) | 36256 (12%) | |
50-59 Yrs | 1641 (9%) | 14104 (11%) | 33684 (12%) | |
60-69 Yrs | 1088 (6%) | 9479 (7%) | 22229 (7%) | |
70+ Yrs | 827 (4%) | 7266 (5%) | 17659 (6%) | |
Median HH Income | $74,950 | $71,105 | $71,407 | |
Total Household Income | < 24K | 501 (9%) | 4469 (11%) | 11113 (12%) |
25-49K | 996 (18%) | 8349 (20%) | 19175 (20%) | |
50-74K | 1237 (22%) | 8831 (21%) | 18546 (20%) | |
75-99K | 1072 (19%) | 7448 (18%) | 14930 (16%) | |
100-199K | 1430 (26%) | 10481 (25%) | 24456 (26%) | |
200K+ | 227 (4%) | 1042 (2%) | 4313 (4%) | |
Highest Education Level | No Diploma | 1293 | 11056 | 28976 |
Diploma or GED | 2866 | 23760 | 50626 | |
Some College | 2588 | 17775 | 39057 | |
Assoc. Degree | 1099 | 7652 | 16359 | |
Bachelors Degree | 1930 | 12263 | 30064 | |
Higher Degree | 655 | 4521 | 13643 | |
Total Housing Units | 5,673 | 42,189 | 96,481 | |
--Owner-Occupied | 3,704 | 25,849 | 61,769 | |
--Renter-Occupied | 1,759 | 14,772 | 30,764 | |
Owner-Occupied Values | < 100K | 404 | 1723 | 6308 |
100-199K | 287 | 3151 | 7378 | |
200-299K | 1416 | 9760 | 18617 | |
300-399K | 1228 | 8665 | 18549 | |
400-499K | 285 | 1852 | 6538 | |
500K+ | 83 | 699 | 4379 | |
Total Working Age Population | 12,551 | 91,935 | 211,535 | |
In Work Force | 9,382 | 67,695 | 153,240 | |
Not In Work Force | 3,169 | 24,240 | 58,295 | |
Workforce Employed | 9,064 | 64,961 | 147,376 | |
Workforce Unemployed | 286 | 2,677 | 5,769 | |
Civlian Workforce | 9,350 | 67,639 | 153,145 | |
Military Workforce | 32 | 56 | 95 | |
Total Households | 5,463 | 40,621 | 92,533 | |
Family Households | 3,890 | 27,883 | 65,061 | |
Non-Family Households | 1,573 | 12,738 | 27,472 | |
Married Couple | 2,915 | 19,885 | 46,909 | |
Other Family | 975 | 7,998 | 18,152 | |
Married w/Child | 1,562 | 9,757 | 22,311 | |
Single Male w/Child | 151 | 1,329 | 2,885 | |
Single Female w/Child | 429 | 3,068 | 6,730 |
Population Change Last Two Decades - Plus Projection
2000 | % | 2010 | % | 2020 | % | 2030 | |
---|---|---|---|---|---|---|---|
Colorado | 4,301,261 | +17 | 5,029,196 | +16 | 5,838,181 | +15 | 6,733,658 |
Adams County | 363,857 | +21 | 441,603 | +20 | 530,680 | +21 | 642,318 |
Broomfield County | 0 | 55,889 | +32 | 73,822 | +28 | 94,282 | |
Denver County | 554,636 | +8 | 600,158 | +23 | 738,611 | +12 | 827,681 |
Total Working Age Population:
Total Households:
Total Working Age Population:
Total Households:
Total Working Age Population:
Total Households: