Retail Space
11147 South Michigan Avenue Chicago, IL 60628
11147 South Michigan Avenue Chicago, IL 60628

Details & Description
Property Highlights
- • Recently renovated restaurant,
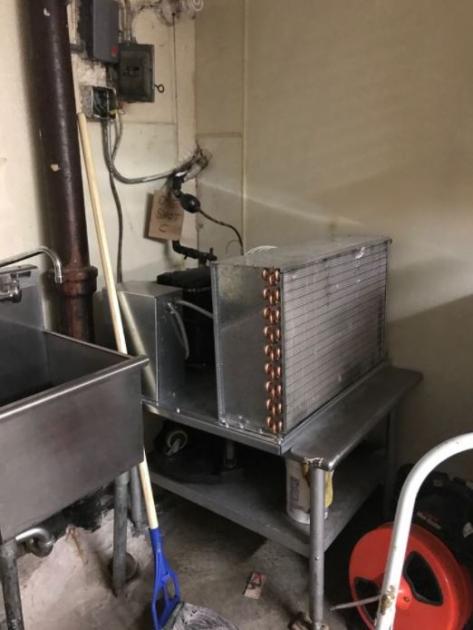
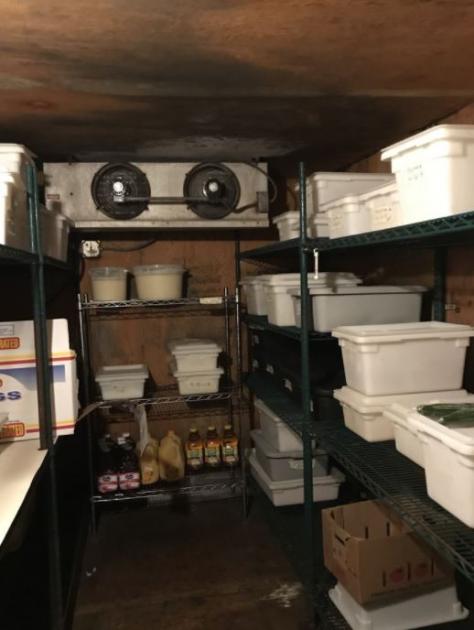
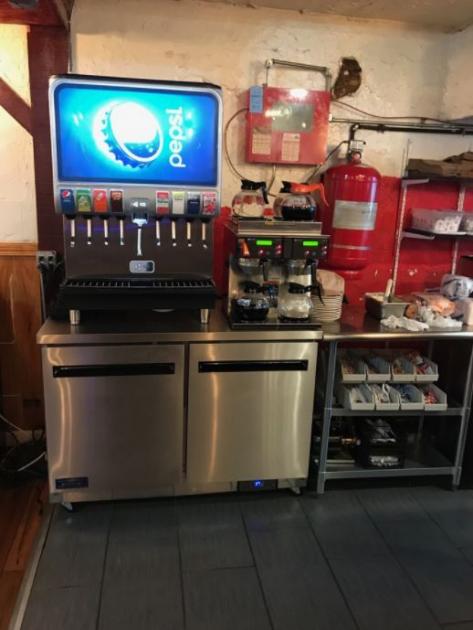
- • Newer restaurant equipment
- • 6400 Sf - 1800 sf per floor 1st, 2nd basement
- • 4 car fenced in private parking
- • restaurant business established in 1969
Additional Photos
Listing Agents

William Mustafa
KW Commercial
O: 312-471-6444
M: 708-261-1150
wmustafa@kwcommercial.com
KW Commercial
O: 312-471-6444
M: 708-261-1150
wmustafa@kwcommercial.com
While we strive to provide the most accurate information, all listing information, and demographic data, is provided by third-parties. As such, MyEListing will not be responsible for the accuracy of the information. It is strongly recommended that you verify all information with the listing agent, and any relevant agencies, prior to making any decisions.


