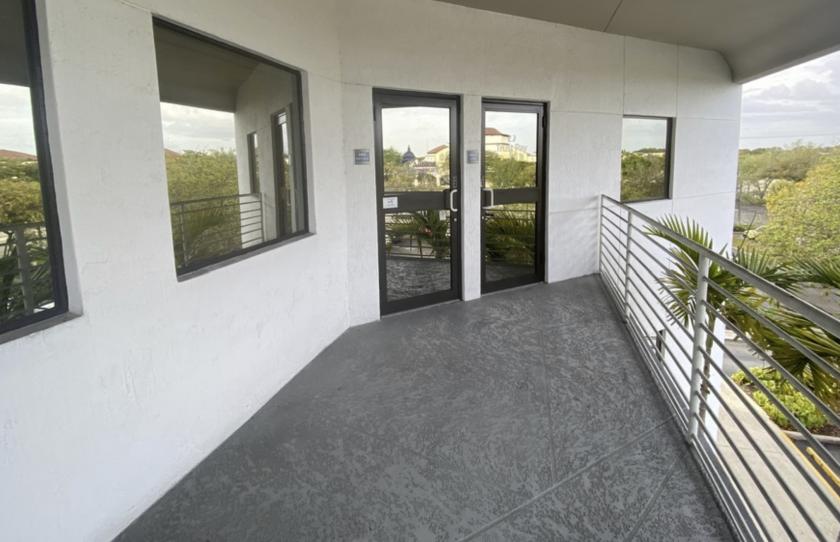
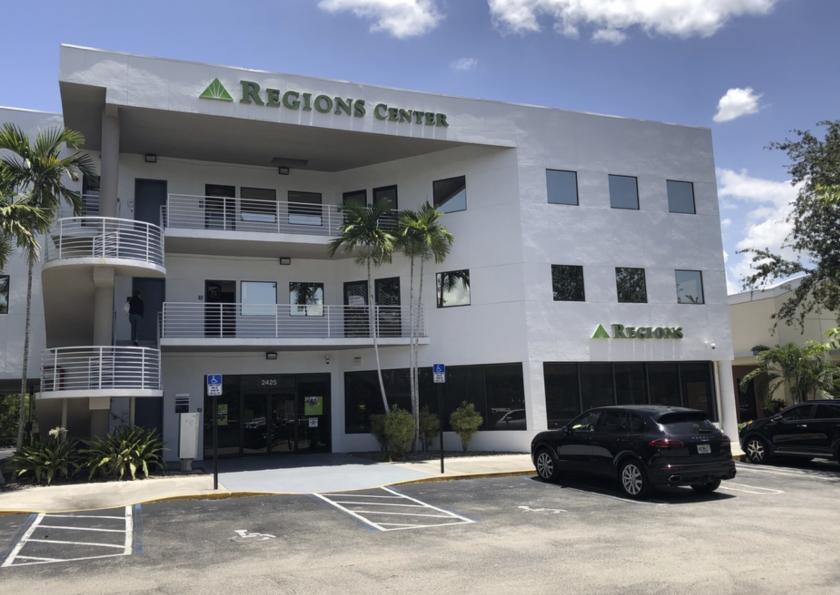
1-Mile | 3-Miles | 5-Miles | ||
---|---|---|---|---|
Total Population | 21,261 | 171,618 | 374,480 | |
Population Median Age | 38 | 39 | 40 | |
Population by Age | 0-9 Yrs | 2905 (13%) | 20638 (12%) | 44344 (11%) |
10-19 Yrs | 2671 (12%) | 23442 (13%) | 48991 (13%) | |
20-29 Yrs | 2870 (13%) | 19901 (11%) | 42438 (11%) | |
30-39 Yrs | 2866 (13%) | 22924 (13%) | 48631 (12%) | |
40-49 Yrs | 2746 (12%) | 22929 (13%) | 51074 (13%) | |
50-59 Yrs | 2982 (14%) | 25028 (14%) | 52745 (14%) | |
60-69 Yrs | 2283 (10%) | 20361 (11%) | 43399 (11%) | |
70+ Yrs | 1937 (9%) | 16396 (9%) | 42859 (11%) | |
Median HH Income | $57,655 | $64,430 | $60,736 | |
Total Household Income | < 24K | 1403 (19%) | 9803 (16%) | 24690 (18%) |
25-49K | 1748 (24%) | 12670 (21%) | 31086 (23%) | |
50-74K | 1387 (19%) | 10701 (18%) | 24184 (18%) | |
75-99K | 981 (13%) | 7891 (13%) | 16817 (12%) | |
100-199K | 1310 (18%) | 12805 (22%) | 27321 (20%) | |
200K+ | 344 (4%) | 4003 (6%) | 9356 (7%) | |
Highest Education Level | No Diploma | 1526 | 10575 | 23180 |
Diploma or GED | 3840 | 33029 | 73983 | |
Some College | 3019 | 24903 | 53661 | |
Assoc. Degree | 1571 | 12648 | 26555 | |
Bachelors Degree | 3252 | 24367 | 53641 | |
Higher Degree | 1337 | 12974 | 30441 | |
Total Housing Units | 7,756 | 63,964 | 150,098 | |
--Owner-Occupied | 4,052 | 37,285 | 87,785 | |
--Renter-Occupied | 3,123 | 20,589 | 45,670 | |
Owner-Occupied Values | < 100K | 585 | 6208 | 15069 |
100-199K | 658 | 5988 | 21571 | |
200-299K | 1004 | 8507 | 19180 | |
300-399K | 1128 | 8346 | 14877 | |
400-499K | 509 | 5152 | 8595 | |
500K+ | 168 | 3084 | 8491 | |
Total Working Age Population | 16,802 | 137,093 | 300,776 | |
In Work Force | 11,224 | 93,883 | 201,896 | |
Not In Work Force | 5,577 | 43,210 | 98,880 | |
Workforce Employed | 10,397 | 87,799 | 189,720 | |
Workforce Unemployed | 826 | 6,019 | 12,082 | |
Civlian Workforce | 11,223 | 93,818 | 201,802 | |
Military Workforce | 1 | 65 | 94 | |
Total Households | 7,174 | 57,873 | 133,455 | |
Family Households | 5,108 | 41,187 | 89,021 | |
Non-Family Households | 2,067 | 16,686 | 44,434 | |
Married Couple | 3,468 | 28,229 | 61,267 | |
Other Family | 1,640 | 12,958 | 27,753 | |
Married w/Child | 1,443 | 10,979 | 23,982 | |
Single Male w/Child | 275 | 1,727 | 3,332 | |
Single Female w/Child | 605 | 4,721 | 10,460 |
Population Change Last Two Decades - Plus Projection
2000 | % | 2010 | % | 2020 | % | 2030 | |
---|---|---|---|---|---|---|---|
Florida | 15,982,378 | +18 | 18,801,310 | +14 | 21,517,610 | +13 | 24,340,457 |
Broward County | 1,623,018 | +8 | 1,748,066 | +11 | 1,942,686 | +9 | 2,120,334 |
Palm Beach County | 1,131,184 | +17 | 1,320,134 | +12 | 1,473,738 | +11 | 1,640,998 |
Total Working Age Population:
Total Households:
Total Working Age Population:
Total Households:
Total Working Age Population:
Total Households: