Retail Space
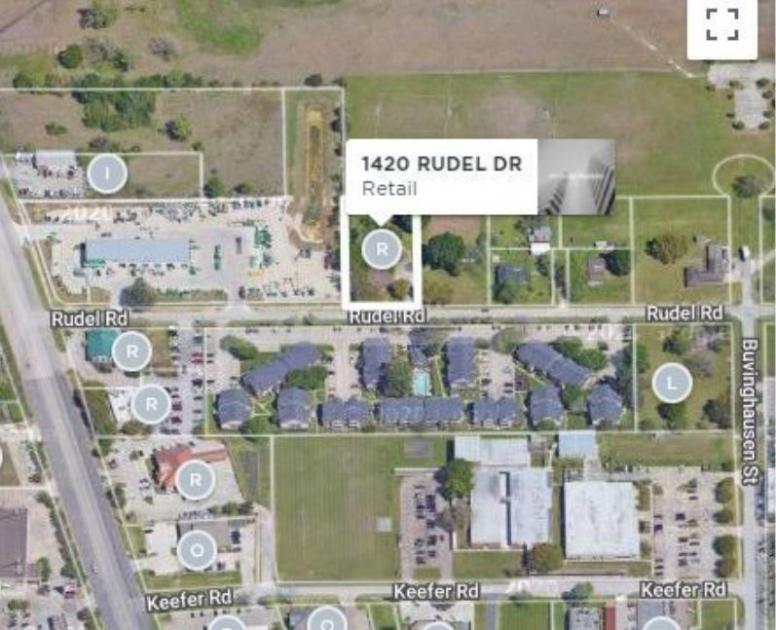
1420 Rudel Road Tomball, TX 77375
1420 Rudel Road Tomball, TX 77375
Details & Description
Property Highlights
- • Commercial Zoning - Flexibility of Use
- • Site 0.92 Acres 40,267 sq.ft.
- • Building on Site 2373 sq.ft.
- • Frontage 138 on Rudel Dr.
- • City of Tomball Utilities All Available
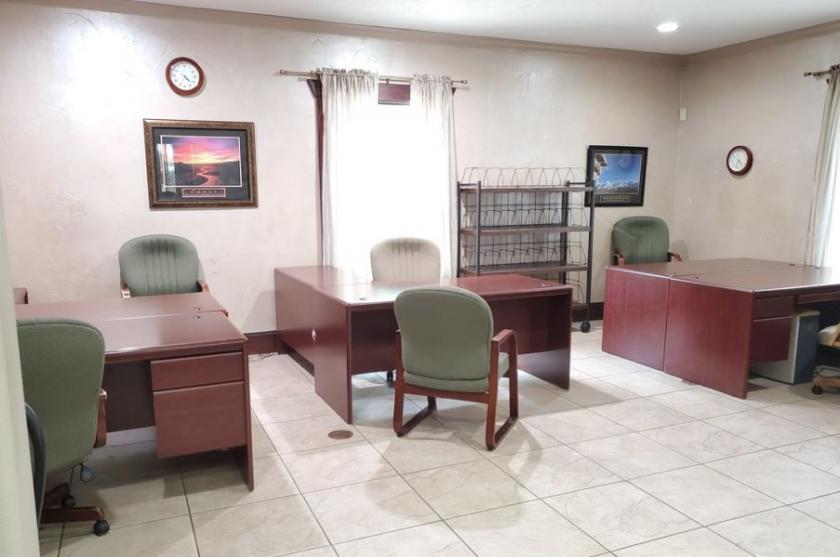
- • 2 Rooms Large Enough for Conference Rooms
Additional Photos


Listing Agents

Kimberly Morris
KW Commercial
O: 281-856-0808
M: 281-804-6540
kimberlymorris@kw.com
KW Commercial
O: 281-856-0808
M: 281-804-6540
kimberlymorris@kw.com
While we strive to provide the most accurate information, all listing information, and demographic data, is provided by third-parties. As such, MyEListing will not be responsible for the accuracy of the information. It is strongly recommended that you verify all information with the listing agent, and any relevant agencies, prior to making any decisions.


