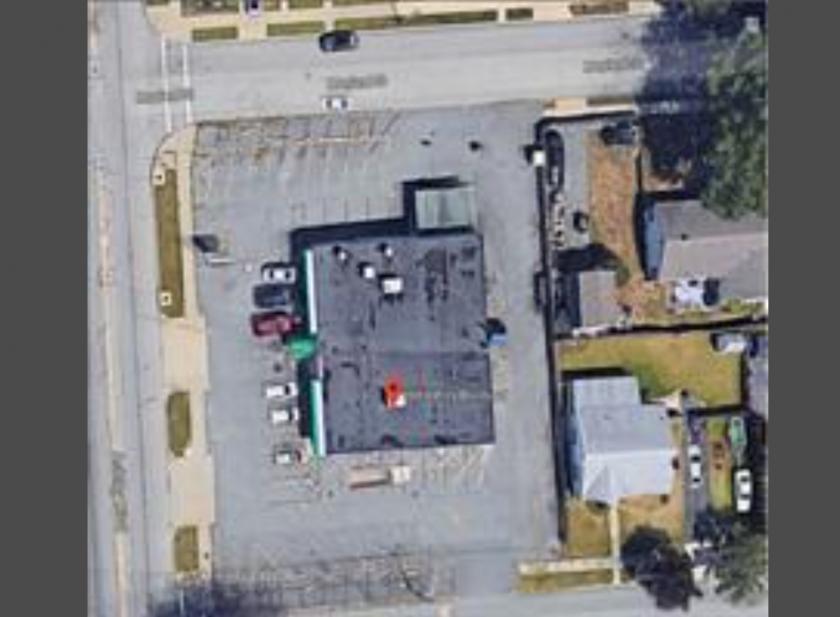
Retail Space
888 Ashley Boulevard New Bedford, MA 02745
888 Ashley Boulevard New Bedford, MA 02745
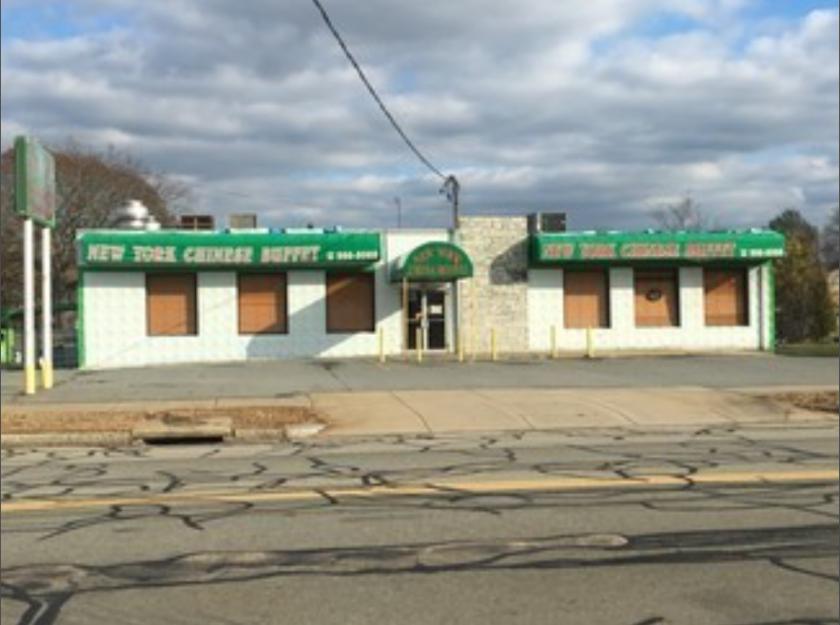
Details & Description
Property Highlights
• 32 surface parking spaces are available Ratio of 4.411,000 SF
• Approximately 13,000 average daily vehicle traffic count
Listing Agents

Cesar Miranda
O: 508-326-8306
M: 508-326-8306
cmiranda@kw.com
O: 508-326-8306
M: 508-326-8306
cmiranda@kw.com
While we strive to provide the most accurate information, all listing information, and demographic data, is provided by third-parties. As such, MyEListing will not be responsible for the accuracy of the information. It is strongly recommended that you verify all information with the listing agent, and any relevant agencies, prior to making any decisions.